Cohort Builder
Every clinical analysis, research study, and quality initiative starts with the same fundamental question: which patients should we include? The Cohort Builder gives you precise control over defining patient populations using clinical diagnoses, demographics, utilization patterns, and custom criteria. These carefully defined cohorts become the foundation for everything from clinical trial screening to quality reporting to longitudinal research studies.
Building Patient Cohorts
This video demonstrates the interface visually without audio narration.
Understanding Your Cohort Landscape
When you open the Cohort Builder, the dashboard gives you an immediate overview of all your patient populations. At the top, summary cards show you the total number of cohorts you've created, the average patient count across those cohorts, how many documents are typically associated with each cohort, and how many organizational categories you're using to group related cohorts. The dashboard also provides insights into age and gender distribution across your cohorts, helping you understand the demographic composition of your patient populations at a glance.
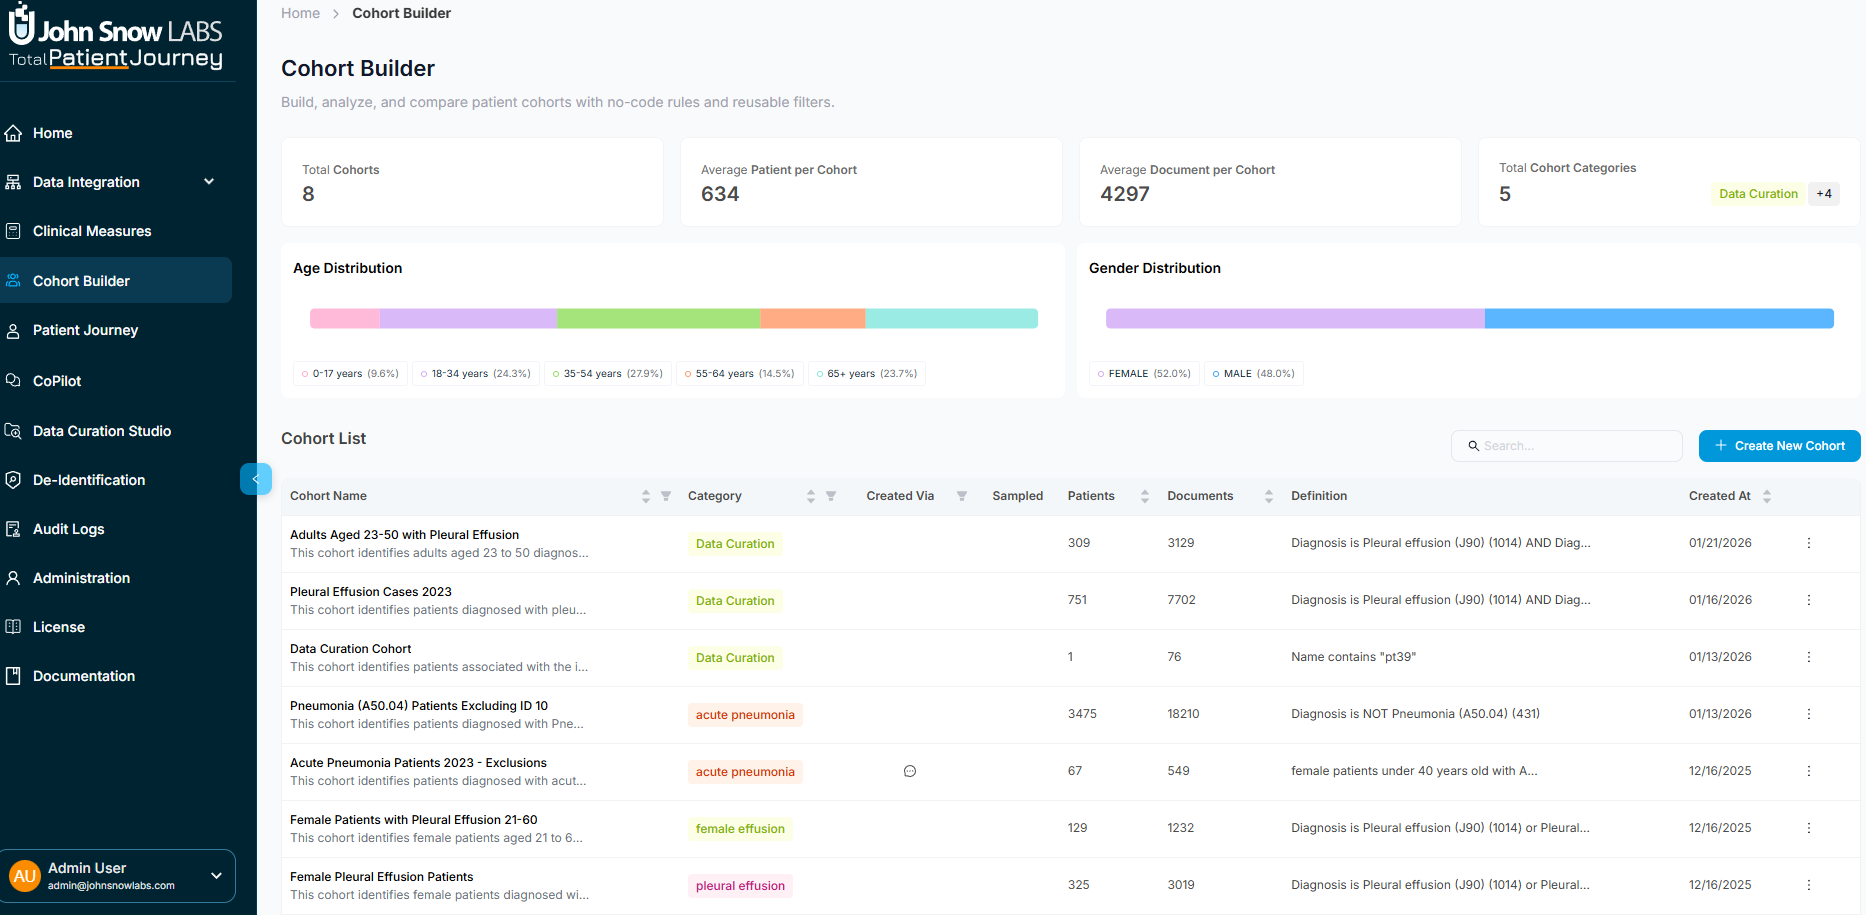
Below the summary, a comprehensive table lists every cohort with key details: its name and category, how many patients and documents it contains, the diagnostic criteria or inclusion logic that defines it, when it was created, and whether new data has arrived since creation. You can search for specific cohorts, sort by any column, and take actions like opening, editing, or deleting cohorts directly from this view.
This dashboard serves as your command center for understanding which patient populations you've defined, how they're being used, and whether they need updating as new data arrives.
Exploring a Cohort's Details
Click on any cohort to open its detail view, which divides into two main areas designed to give you both the big picture and patient-level specifics.
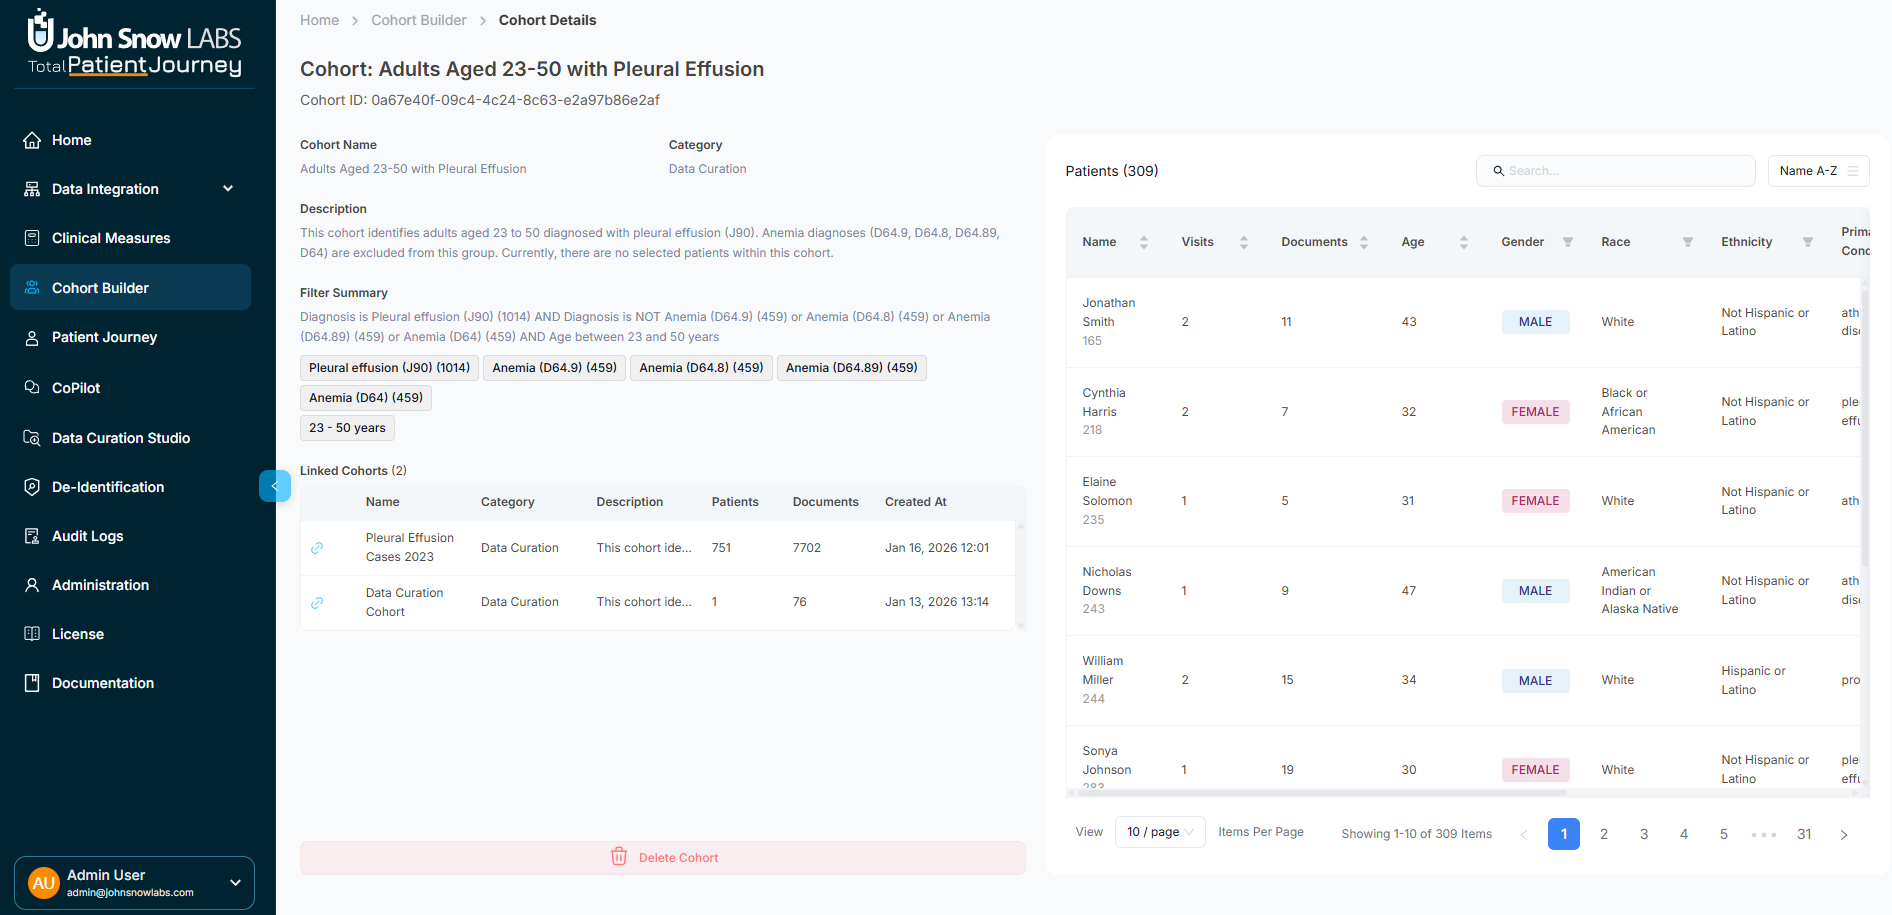
Cohort Summary Panel
The left panel displays essential information about the cohort itself. You'll see the cohort's name and organizational category, a clinical description explaining its purpose, the definition tags showing which ICD, SNOMED, or OMOP codes define membership, when it was created, and how many patients and documents are included.
If this cohort is connected to other cohorts in a hierarchical relationship—for example, a "Pleural Effusion" supercohort with subcohort for "Adults Aged 23-50 with Pleural Effusion": those relationships appear here as well. This summary gives you complete transparency into what the cohort represents and how it fits into your broader organizational structure.
Patient List and Details
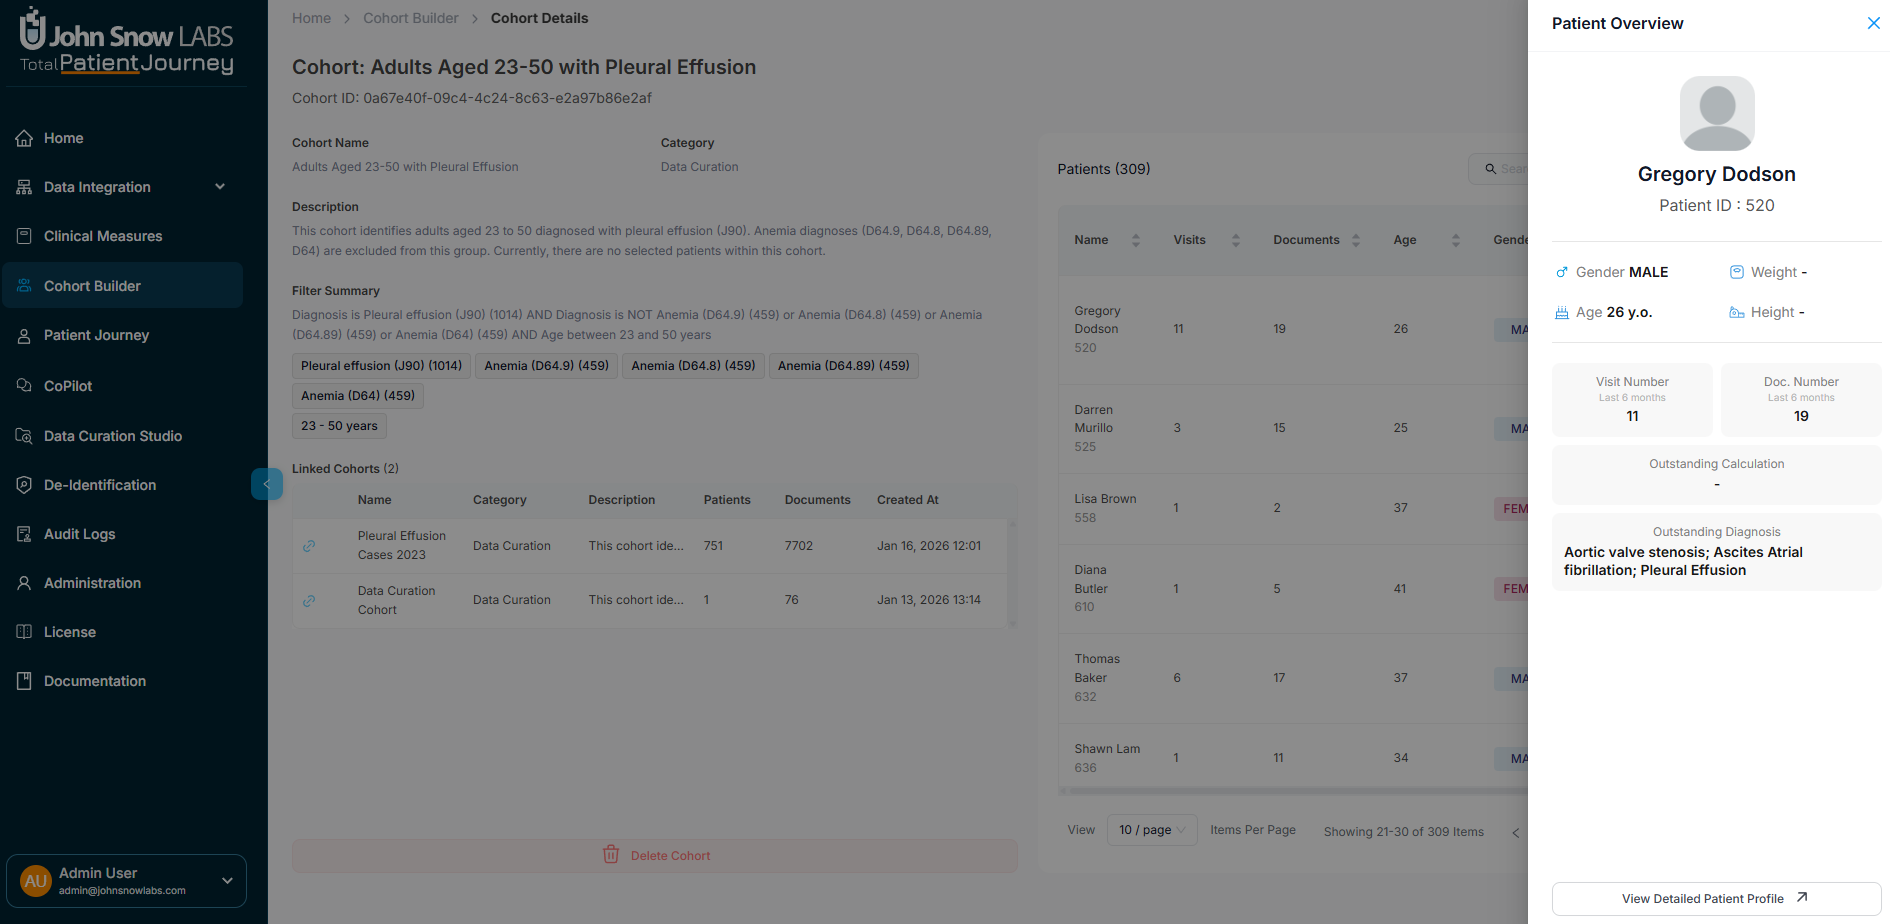
The main panel shows every patient in the cohort with rich demographic and clinical metadata. For each patient, you can see their name, how many visits and documents they have, age, gender, race, ethnicity, primary condition, specific diagnosis tags, and when they were most recently seen. An update indicator flags patients with newly ingested clinical data since the cohort was created.
The table is fully interactive—sort by any column to identify patterns, search for specific patients by name or condition, and scroll through large populations efficiently. Click on any patient row to open a quick overview drawer that provides a snapshot of their demographics, recent encounter and document activity from the last six months, key clinical measures like BMI or risk scores, and active diagnoses. From this drawer, you can also jump directly to the patient's full profile for comprehensive review.
This design lets you understand both the cohort composition at a glance and drill into individual patients without losing context.
Building a New Cohort
Creating a cohort follows a three-step process that takes you from defining broad inclusion criteria to fine-tuning your population to documenting what you've created.
Step 1: Define Your Patient Selection Criteria
Start by specifying which patients should be included in your cohort using sophisticated filtering capabilities. You can filter by clinical diagnoses using ICD, SNOMED, or OMOP codes, select patients with specific primary conditions, narrow by age range, filter by demographics including gender, race, and ethnicity, specify visit frequency patterns, set document volume thresholds, or use free-text search to find patients by specific terms.
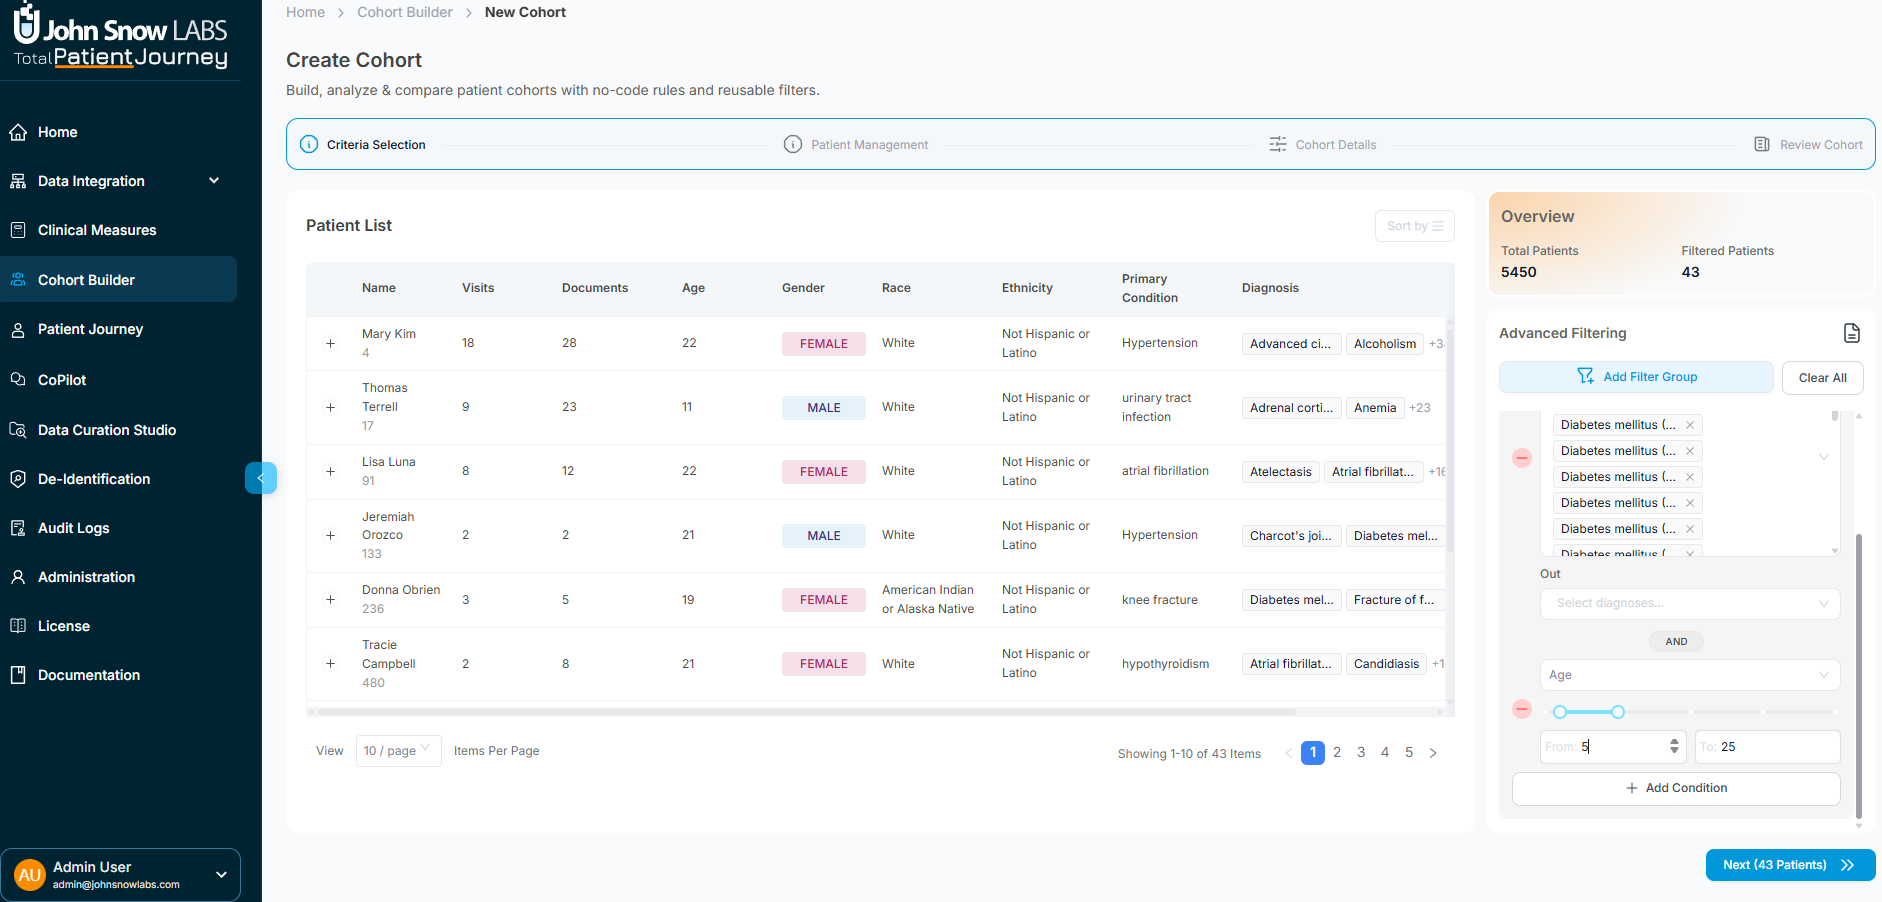
The filtering system supports complex nested logic with AND/OR conditions, letting you build precisely the population you need. For example, you might include patients with diabetes diagnoses AND hypertension, OR patients with diabetes who are over 65 years old. You can also define explicit exclusion criteria to remove patients who meet certain conditions.
As you adjust filters, the patient list updates in real time, showing exactly who would be included based on your current criteria. This immediate feedback lets you explore different population definitions and refine your criteria iteratively until you've captured exactly the right group.
Step 2: Manual Patient Exclusions
Sometimes automated filters aren't enough—you need to manually remove specific patients from your cohort. This might happen when you identify outliers, edge cases with unusual data quality issues, or patients who technically meet your criteria but don't fit your analytical intent.
In this step, review the filtered patient list and select any individuals who should be excluded. You can select multiple patients at once, then click "Exclude Selected" to remove them from the cohort. The patient count and metadata update immediately, showing your refined population.
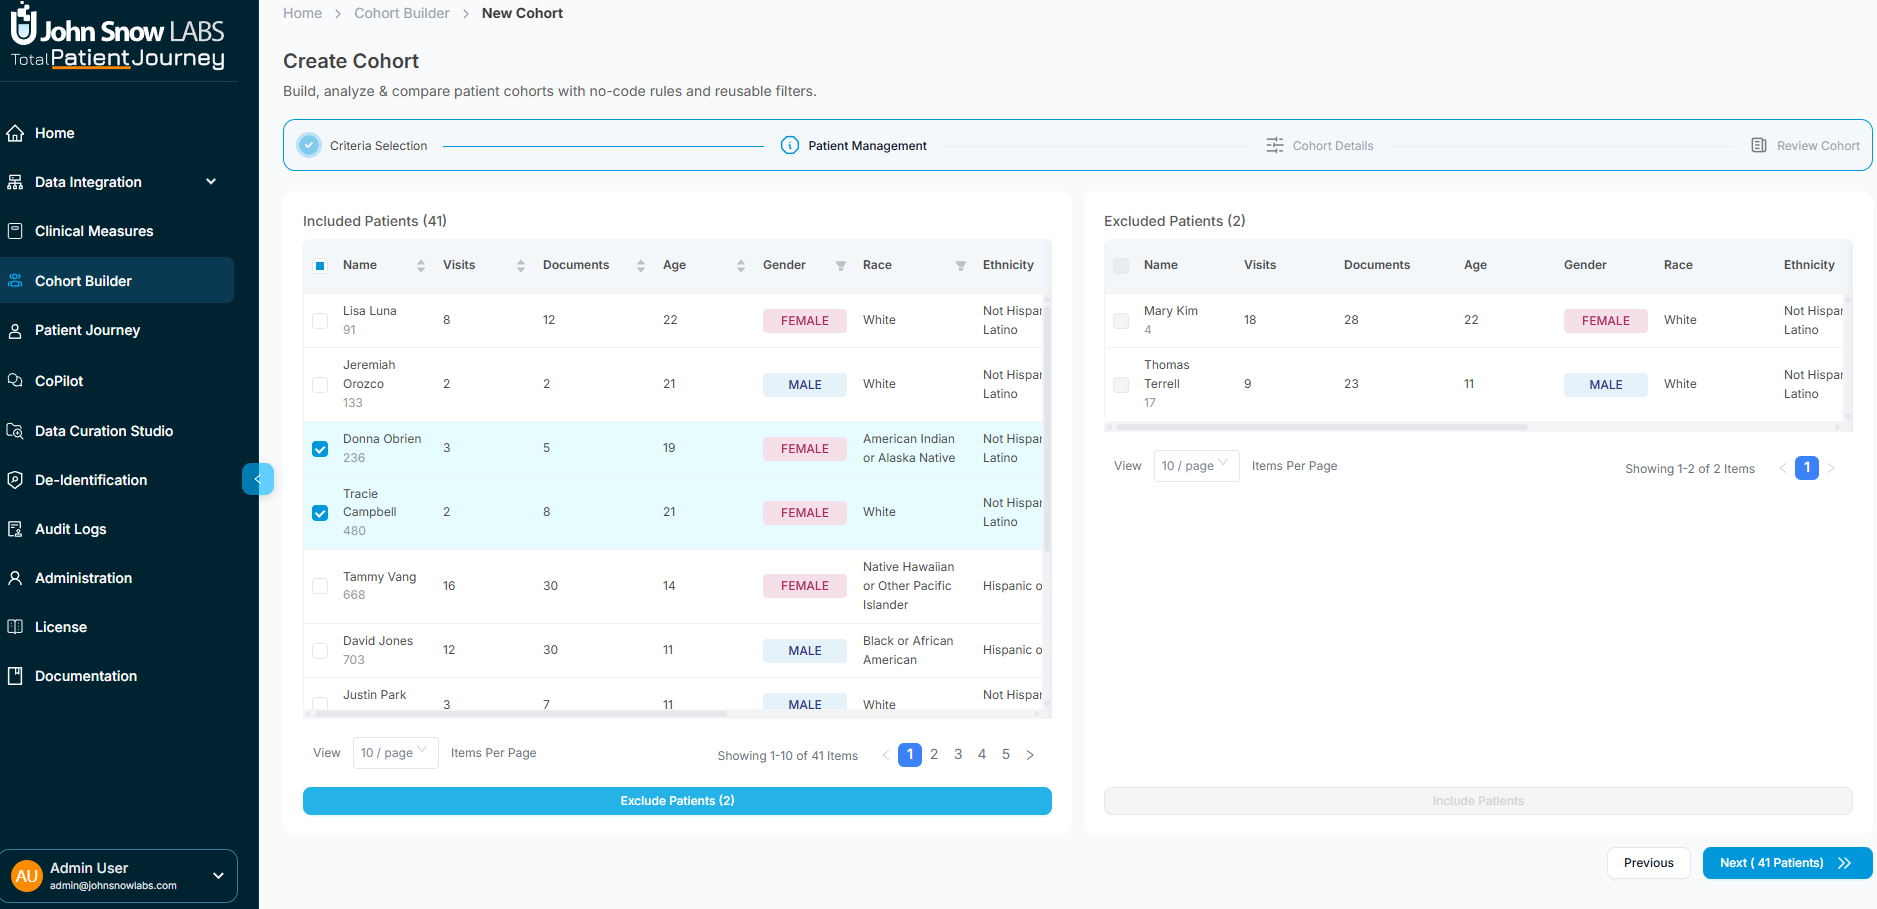
This manual refinement capability ensures you can create research-grade cohorts that meet rigorous inclusion standards, even when automated criteria can't fully capture all the nuances.
Step 3: Document Your Cohort
Finalize your cohort by providing essential metadata. Give it a clear, descriptive name that identifies its purpose—something like "Heart Failure Patients 2024 Q1" or "Diabetes Registry - Active Patients." Assign it to an organizational category to help group related cohorts together.
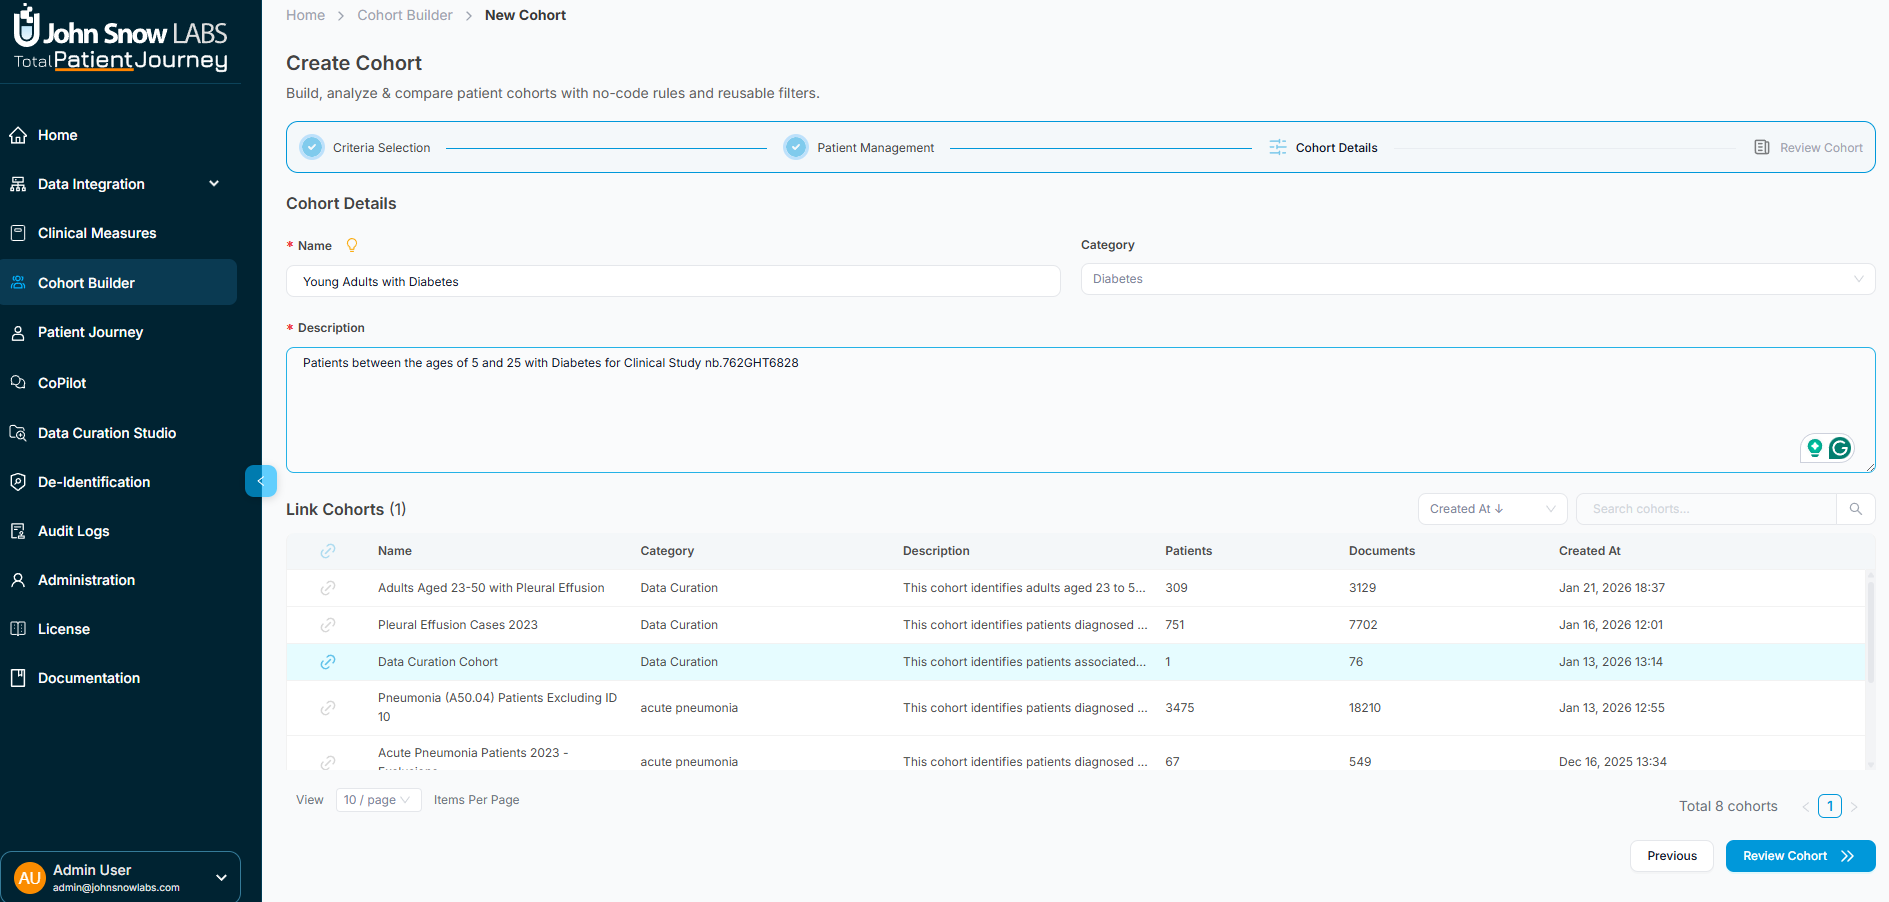
Add a clinical description that explains the cohort's purpose, target population, and any special considerations. This documentation helps other team members understand the cohort's intent and supports reproducibility in research workflows.
If this cohort relates to other existing cohorts, you can link them together to create hierarchical relationships. For example, you might create a subcohort of "Diabetes with Complications" that links to a parent "All Diabetes Patients" cohort.
Throughout this step, a filter summary panel displays all the criteria and exclusions you've applied, creating a complete audit trail of how the cohort was constructed. When everything looks correct, click "Save Cohort" to finalize it.
Working with Linked Cohorts
Complex clinical questions often require analyzing related patient populations together. The Cohort Builder supports hierarchical and relational cohort structures that let you organize populations in meaningful ways.
You can create supercohort and subcohort relationships—for example, a broad "Cardiovascular Disease" supercohort containing subcohorts for "Heart Failure," "Coronary Artery Disease," and "Arrhythmias." These relationships help you organize condition-based groupings, build staged analytical pipelines where one cohort feeds into the next, and navigate between related populations to compare outcomes or demographics.
Linked cohorts appear in the Cohort Details sidebar with metadata showing patient overlap and lineage, making it easy to understand how your populations relate to each other and ensuring you can trace analytical decisions back through the cohort hierarchy.
Putting Cohorts to Work
The cohorts you build become the foundation for diverse clinical and operational activities. Use them for clinical trial screening to identify eligible participants, disease-based segmentation for targeted interventions, risk stratification to identify high-risk patients, quality reporting to measure performance on specific populations, longitudinal research tracking outcomes over time, population health assessments, and cohort-based measure evaluation through the Clinical Measures module.
Every cohort you create is immediately available across the platform, ensuring that your carefully defined patient populations can power analytics, drive quality improvement, support research, and inform clinical decision-making.
Why Cohort Definition Matters
High-quality analytics require high-quality cohorts. The Cohort Builder ensures every patient population you create is accurately defined using transparent inclusion and exclusion logic, fully auditable with complete documentation of how it was constructed, clinically interpretable through clear metadata and descriptions, and directly integrated into downstream analytical workflows.
By providing sophisticated filtering, manual refinement capabilities, comprehensive documentation, and hierarchical organization, the Cohort Builder transforms patient population definition from an ad-hoc, inconsistent process into a standardized, reproducible, and trustworthy foundation for data-driven healthcare insights.