Database Explorer
Imagine a data analyst wants to verify that yesterday's clinical note ingestion completed successfully. They need to see how many new conditions were extracted, check if diabetes diagnoses mapped correctly to OMOP codes, and validate that patient counts match expectations. The Database Explorer makes this straightforward, browse to the relevant tables, preview the data, or write a quick SQL query to get precise answers.
The Database Explorer is your window into all structured data within Patient Data Intelligence. Whether you're a clinical researcher validating cohort logic, a data engineer troubleshooting an ingestion pipeline, or an analyst exploring OMOP tables, this module provides both visual browsing for quick exploration and SQL querying for detailed investigation, all within a secure, read-only environment that ensures data integrity.
Database Explorer Interface
This video demonstrates the interface visually without audio narration.
Investigate Data Sources Without Coding
The Database Explorer gives you complete visibility into Patient Journey Intelligence's data infrastructure:
Explore Without Code: Browse tables visually to see what's available. Click on the condition_occurrence table to instantly see row counts, column structure, and preview actual patient conditions, no SQL required.
Query With Precision: Need to count how many patients have Type 2 Diabetes with HbA1c >9%? Write a SQL SELECT query joining condition_occurrence with measurement tables and get results in seconds.
Connect External Data: Already have a PostgreSQL database with lab results or a MySQL database with claims data? Connect it to Patient Journey Intelligence and query it alongside your OMOP data for comprehensive analysis.
Validate Everything: After running an NLP pipeline on discharge summaries, browse the extracted entities table to verify medications were identified correctly. Check audit logs to see who accessed sensitive patient records. Inspect cohort generation tables to understand why 1,247 patients met your inclusion criteria.
Troubleshoot Issues: When an ingestion job reports errors, query the ingestion logs table to see exactly which records failed and why. Preview the source data to identify formatting issues or missing required fields.
Two Ways to Work With Data
The Database Explorer offers two complementary modes depending on your needs and technical comfort level.
Table Browsing Mode
Perfect for exploration and quick validation. Open the Database Explorer and you'll see a card-based layout showing every table in your database.
Each card displays key metadata at a glance:
- Table Name: The formal identifier (e.g.,
condition_occurrence,drug_exposure) - Schema: Helps you navigate between different schemas: audit, cohort_generation, data_curation, conversation, etc.
- Row Count: How many records are in the table
- Column Count: Number of data fields
- Estimated Table Size: Storage footprint
You can switch between List View (default card-based layout) and Relational View to visualize the database schema as an entity-relationship diagram.
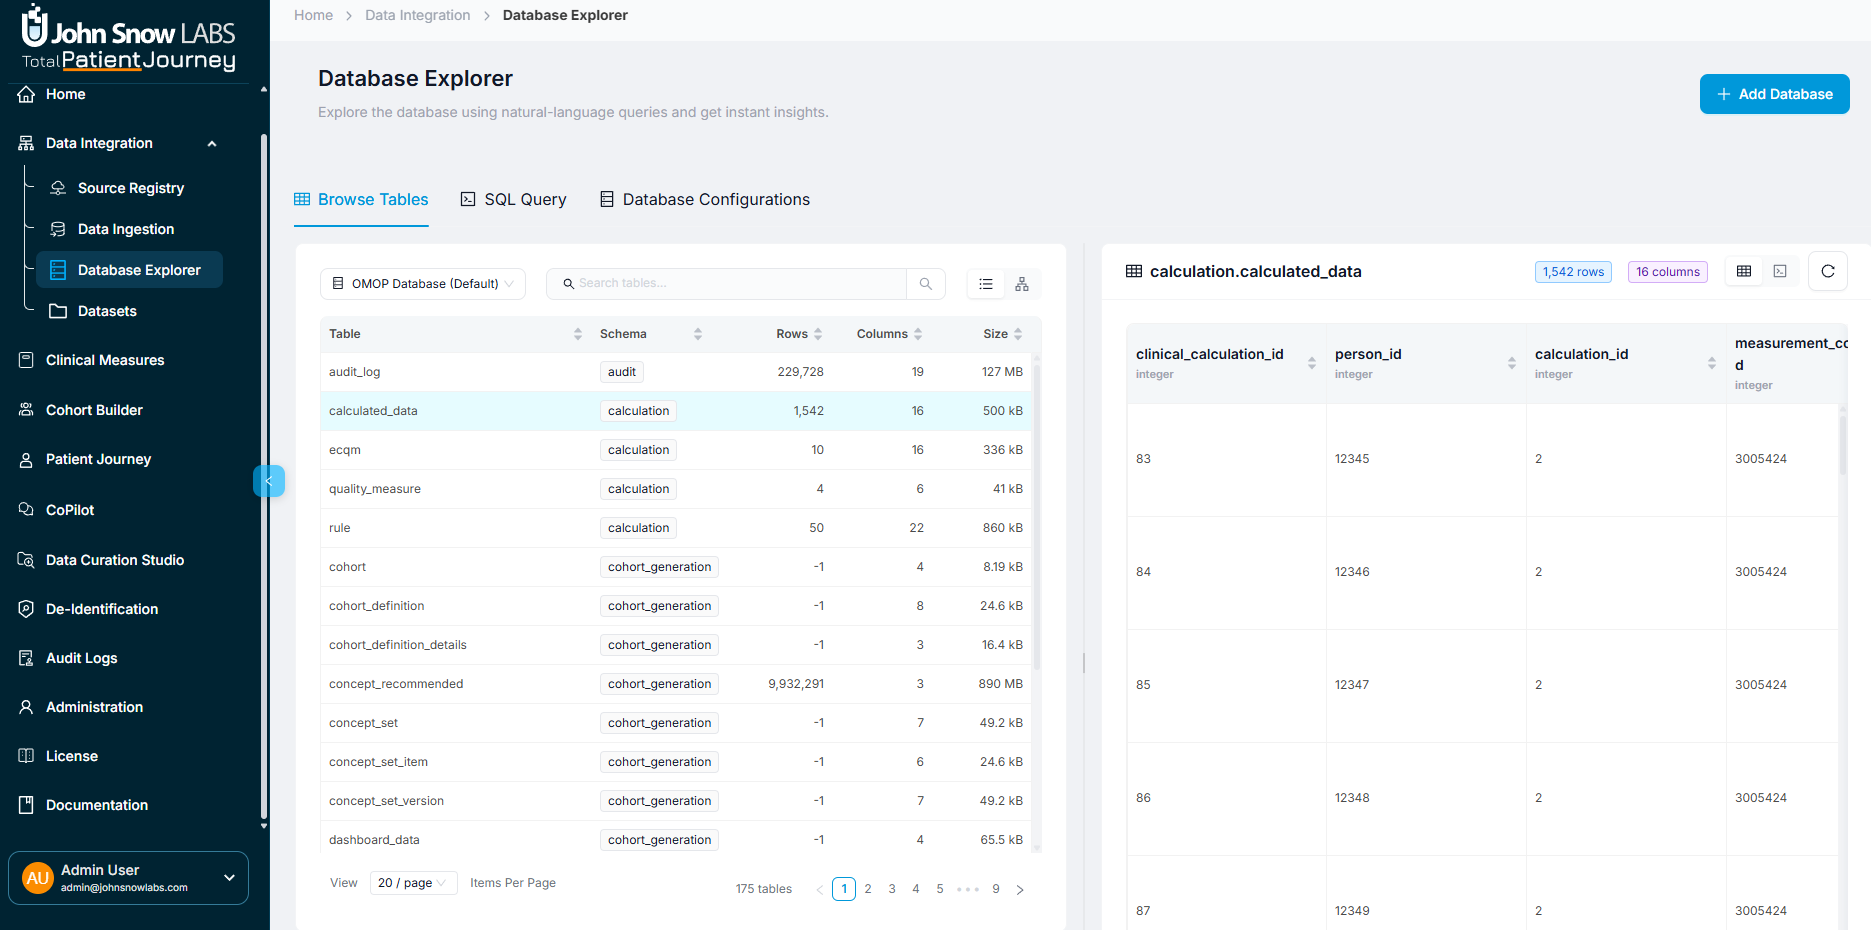
List View displays tables as cards with key metadata at a glance
In Relational View, each table appears as a box showing its fields and data types, with visual connections representing foreign key relationships between tables. This makes it easy to understand table structure and how data relates across your database, perfect for designing queries or understanding complex OMOP relationships like how person links to condition_occurrence and measurement tables.
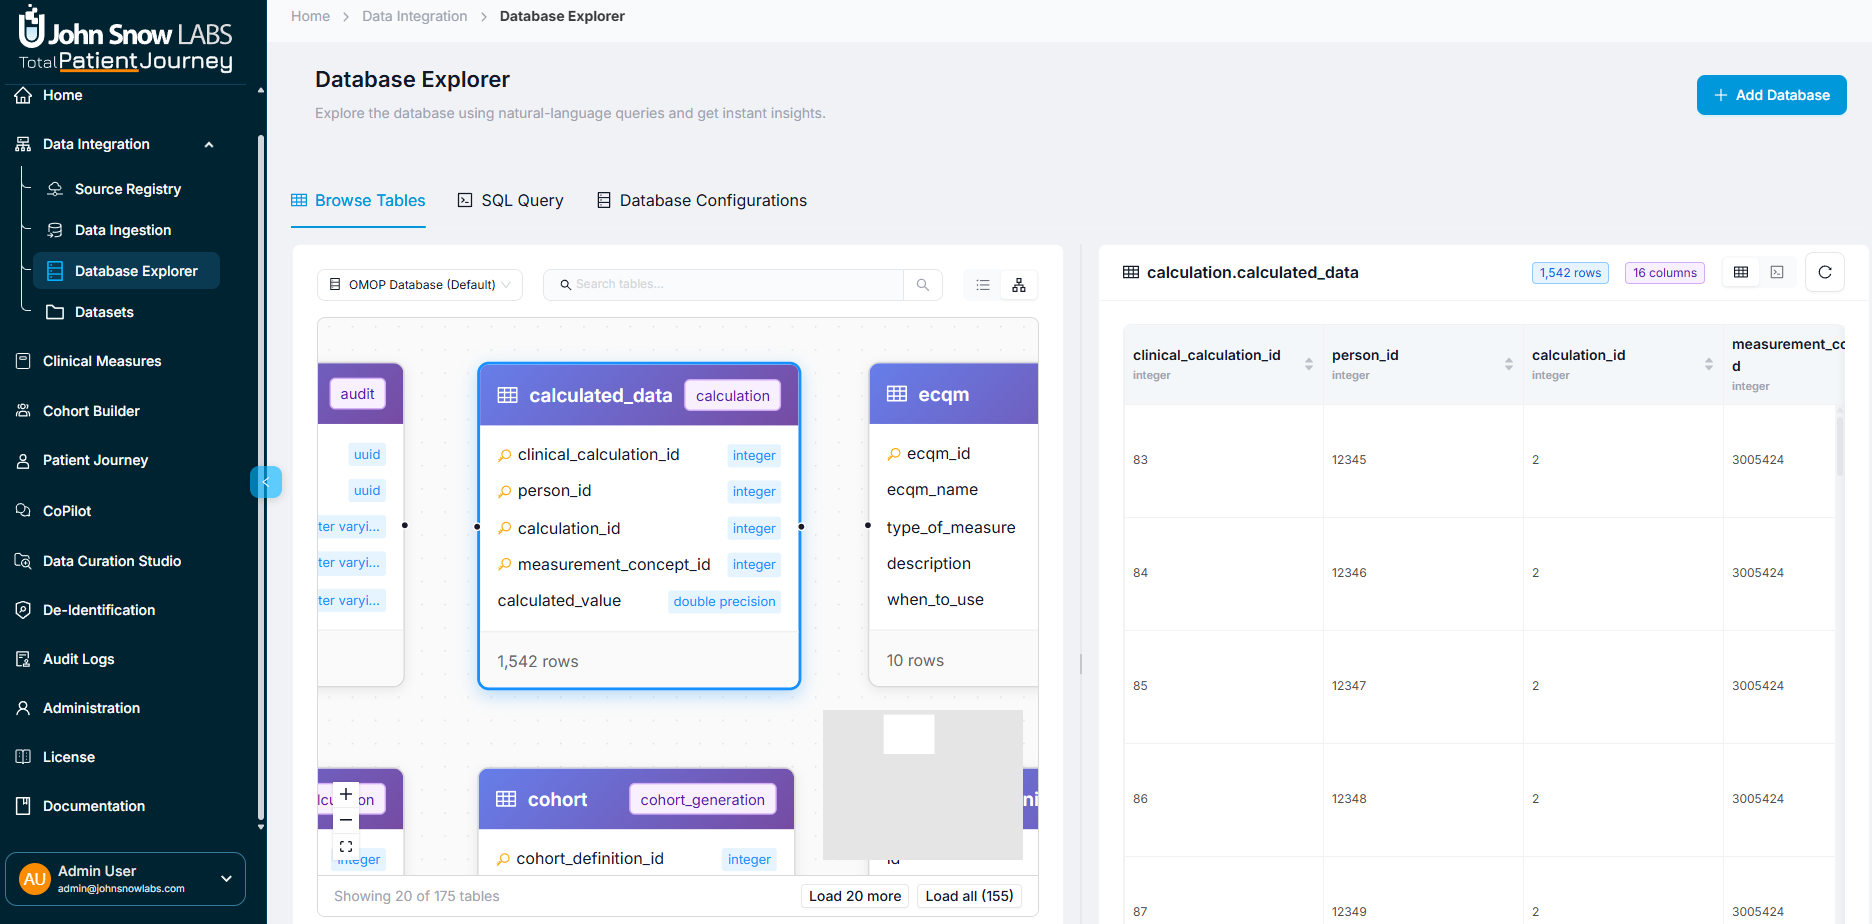
Relational View displays tables as connected boxes with fields and data types, making database relationships easy to understand
Example: A data engineer's morning routine
You open the Database Explorer to check yesterday's ingestion job. Browsing the tables, you notice:
- The
persontable shows 45,892 rows (same as yesterday, good, no duplicate patients) - The
measurementtable jumped from 2.1M to 2.3M rows (200K new lab results, that matches the ingestion report) - A new
nlp_entitiestable appeared with 156,000 rows (the overnight NLP extraction on discharge summaries completed successfully)
You click the condition_occurrence table to preview the data. The table shows recent diabetes diagnoses with proper OMOP concept_ids (201826 for Type 2 Diabetes). Everything looks correct, validation complete in under 2 minutes.
Clicking Into a Table
When you click any table card, a detailed preview pane opens showing:
- The first N rows of actual data from the table
- Field names, data types, and formats for each column
- View toggle to switch between table view (default) and JSON view for inspecting raw data structure
- A refresh button to reload the content if data is being actively updated
This instant preview lets you validate ingestion outputs, inspect NLP-derived clinical facts, debug OMOP mappings, review cohort construction artifacts, and verify audit records, all without writing a single line of SQL. Switch to JSON view when you need to see nested data structures or copy raw values for troubleshooting.
SQL Query Mode
For users comfortable with SQL, this mode provides a full-featured editor for precise data analysis. Write SELECT queries, join multiple tables, aggregate data, filter with complex conditions, and export results to CSV.
Example: A clinical researcher's investigation
Your research protocol requires identifying female patients aged 40 or older with a specific race background who have had more than 5 visits, potential candidates for a frequent utilizer study. Rather than manually filtering thousands of records, you write a SQL query:
SELECT
    p.person_id,
    COUNT(vo.visit_occurrence_id) AS visit_count
FROM tpj.visit_occurrence vo
JOIN tpj.person p ON vo.person_id = p.person_id
WHERE p.gender_concept_id = 8532  -- Female
  AND EXTRACT(YEAR FROM AGE(CURRENT_DATE, p.birth_datetime)) >= 40
  AND p.race_concept_id = 8527  -- White
GROUP BY p.person_id
HAVING COUNT(vo.visit_occurrence_id) > 5
ORDER BY visit_count DESC
Results appear instantly: 49 patients meet your criteria.
Switching Between Databases
At the top of the interface, the Database Selector dropdown lets you choose which database to work with:
- OMOP Database (default): Patient Journey Intelligence's normalized clinical data repository containing standard OMOP tables like
person,condition_occurrence,drug_exposure,measurement,procedure_occurrence, andvisit_occurrence - Custom Databases: External data sources you've connected, such as your legacy EHR database, departmental research repository, or institutional data warehouse
Connecting Your Own Databases
Patient Journey Intelligence's OMOP database is powerful, but you might have other data sources you need to query alongside it, a legacy EHR system, a departmental research database, or an institutional data warehouse. The Database Explorer lets you connect these external databases and query them just like your OMOP data.
Click Add Database to start. You'll see a connection form asking for:
Required Information:
- Display Name: What you want to call this database (e.g., "Legacy EHR" or "Cardiology Research DB")
- Optional Description: Notes about what this database contains or why you're connecting it
- Host: Server address (e.g.,
db.hospital.orgor10.0.1.50) - Port: Database port (typically 5432 for PostgreSQL, 3306 for MySQL)
- Database Name: The specific database on that server
- Username and Password: Credentials with read access
Advanced Options (if needed):
- SSL/TLS encryption settings: Enable secure connections for sensitive data
- Connection timeouts: Adjust if your database is slow to respond
- Connection pooling: Configure for high-performance scenarios
Supported Databases:
- PostgreSQL: The most common choice for healthcare data warehouses
- MySQL: Popular for departmental databases and legacy systems
Other database engines may be supported depending on your deployment configuration. Contact your administrator if you need to connect a different database type.
Once connected, your external database appears in the Database Selector dropdown. Switch to it and browse tables or write queries just like you do with the OMOP database. You can even write queries that join OMOP data with external data sources for comprehensive analysis.
SQL Query Editor Features
The SQL Query mode isn't just a text box, it's a full-featured editor designed to make querying fast, accurate, and safe.
Safety First: Read-Only Access
⚠ Important: The Database Explorer only allows SELECT statements. You cannot INSERT, UPDATE, DELETE, or ALTER data. This protects data integrity and ensures regulatory compliance, you can explore and analyze freely without risk of accidentally modifying clinical records.
If you try to run a write operation, you'll see a clear error message explaining that only read operations are permitted.
Editor Capabilities
When you open the SQL Query mode, you get a professional-grade editor with features that make querying easier:
SQL Syntax Highlighting: Keywords, table names, and strings are color-coded so your query is easy to read at a glance.
Autocomplete: Start typing a table name and the editor suggests completions. Type SELECT * FROM cond and it offers condition_occurrence. This speeds up query writing and reduces typos.
Inline Error Diagnostics: Make a syntax error? You'll see a red underline with a helpful message before you even run the query. No more waiting for cryptic database errors.
Smart Results Display:
- Pagination: Query returned 50,000 rows? Results are paginated so your browser doesn't freeze
- Sortable Columns: Click any column header to sort ascending or descending
- CSV Export: One-click export to download results for analysis in Excel, R, or Python
Example: Debugging an ingestion issue
Your ingestion job completed but reported 50 warnings. You open the SQL editor and query the ingestion logs:
SELECT
    log_time,
    source_file,
    error_type,
    error_message,
    record_id
FROM ingestion_logs
WHERE job_id = 'job_20241215_083045'
  AND severity = 'WARNING'
ORDER BY log_time DESC
Results show all 50 warnings were "Invalid date format in birth_date field", all from the same source file. You identify the root cause in seconds, export the problematic record IDs to CSV, and send them to the data provider for correction.
Typical Database Explorer Workflows
Different teams use the Database Explorer in different ways. Here are the most common workflows:
Data Validation
Scenario: You just finished ingesting 3 months of lab results from a new data source.
What you do: Browse to the measurement table and check the row count, it should match the ingestion report. Preview the data to verify units are correct (mg/dL for glucose, not mmol/L). Query for specific LOINC codes to confirm lab tests mapped correctly. Cross-reference the measurement table against the ingestion logs to ensure no records were silently dropped.
Troubleshooting & Debugging
Scenario: An NLP pipeline ran overnight but a colleague reports missing medication extractions.
What you do: Open the SQL editor and query the NLP output tables. Count extracted entities by type, you find 45,000 conditions and 12,000 procedures, but only 200 medications (should be thousands). Query the NLP processing logs filtered by entity_type='Drug' to see error messages. Discover the medication extraction model failed to load due to a configuration issue. You fix the config and re-run the pipeline.
Clinical Data Review
Scenario: A clinician asks how many diabetic patients have recent HbA1c measurements.
What you do: Write a SQL query joining condition_occurrence (for diabetes diagnosis) with measurement (for HbA1c results) and person (for demographics). Filter for measurements in the last 6 months. Export to CSV and share with the clinical team, they have the answer in minutes, not days.
Cohort Generation QA
Scenario: You defined a complex cohort with multiple inclusion criteria, but the final count seems low.
What you do: Query the cohort generation intermediate tables to see how many patients passed each criterion. You discover that the "recent office visit" criterion excluded 80% of candidates because the date range was too narrow. Adjust the cohort definition and re-run.
Platform Usage Monitoring
Scenario: Your compliance team needs to know who accessed a specific patient's data.
What you do: Query the audit logs table filtered by patient_id. Results show every user, timestamp, module, and action (view, export, edit). Export the audit trail and provide it to the compliance team for their investigation.
Best Practices
Getting the most from the Database Explorer while keeping queries efficient and safe:
Start with Browse Mode: Before writing complex queries, browse the tables to understand what's available. Click into a few tables to see column names and data formats. This reconnaissance saves time and prevents query errors.
Build Queries Incrementally: Don't write a 10-table join on your first try. Start simple, SELECT * FROM person LIMIT 10. Add complexity gradually. Test each addition before moving to the next.
Use LIMIT During Development: While testing queries, add LIMIT 100 to avoid accidentally returning millions of rows. Remove the LIMIT only when you're ready for full results.
Correlate With Source Systems: When validating ingestion, cross-reference row counts and data samples with the original source system or ingestion logs. If numbers don't match, investigate before trusting the data.
Document Complex Logic: If you write a sophisticated query with multiple joins and filters, add comments explaining the logic: -- Get all diabetics with HbA1c >9 in 2024. Your future self (and your colleagues) will thank you.
Benefits of Direct Database Access
The Database Explorer is fundamental to how Patient Journey Intelligence enables data transparency and trust. Here's why it matters:
Democratized Access: Non-technical users can browse tables visually. Technical users can write precise SQL queries. Everyone gets the level of access they need without barriers.
Complete Visibility: See every table, OMOP clinical data, NLP outputs, cohort artifacts, audit logs, ingestion logs, calculation results. Nothing is hidden. You can inspect the data at any stage of processing.
Safe Exploration: The read-only guarantee means you can query freely without fear of breaking something. Explore, experiment, and learn, you can't accidentally delete or modify clinical records.
Fast Troubleshooting: When something goes wrong, you can investigate immediately. No waiting for database admins to run queries for you. Query the logs, identify the issue, and fix it.
Regulatory Compliance: Export complete audit trails showing who accessed what data and when. Validate data lineage by tracing records from ingestion through transformation to final OMOP tables.
Summary
The Database Explorer is your direct connection to all data in Patient Journey Intelligence. Whether you're validating yesterday's ingestion, troubleshooting an NLP pipeline, researching a clinical question, or auditing platform usage, this module provides the visibility and tools you need.
Its dual-mode design, visual browsing for exploration, SQL querying for precision, ensures that everyone from data engineers to clinical researchers can work with the data effectively. The read-only security model preserves data integrity while enabling unlimited analytical freedom.
From quick validation checks to sophisticated multi-table analyses, the Database Explorer makes Patient Journey Intelligence's data fully transparent, trustworthy, and actionable.