Patient Journey
Clinical data lives in silos. Diagnoses appear in one system, medications in another, procedures scattered across departments, and the richest clinical insights buried in free-text notes. For clinicians trying to understand a patient's full story, this fragmentation means clicking through multiple screens, reconciling conflicting information, and piecing together timelines manually.
Patient Journey Timeline
This video demonstrates the interface visually without audio narration.
The Patient Journey agent solves this by consolidating all available clinical information into a single, longitudinal profile. Every encounter, every diagnosis, every medication, every procedure, and every clinical note comes together in one place, organized chronologically and linked back to its source.
Whether you're a clinician reviewing a patient before an appointment, a researcher investigating disease progression patterns, or an analyst validating data quality, Patient Journey gives you the complete picture with full traceability.
Monitor Population Health at a Glance
Before diving into individual patient records, the module provides system-level metrics that summarize your entire patient dataset. These indicators help you understand the scope and composition of your data:
- Total Patients — Unique individuals in the environment
- Conditions — Distinct clinical diagnoses represented across the population
- Gender Distribution — Demographic proportions visualized for quick reference
- Total Documents — Volume of associated clinical documentation available for analysis
Use these metrics to establish baseline epidemiological understanding before exploring individual profiles.
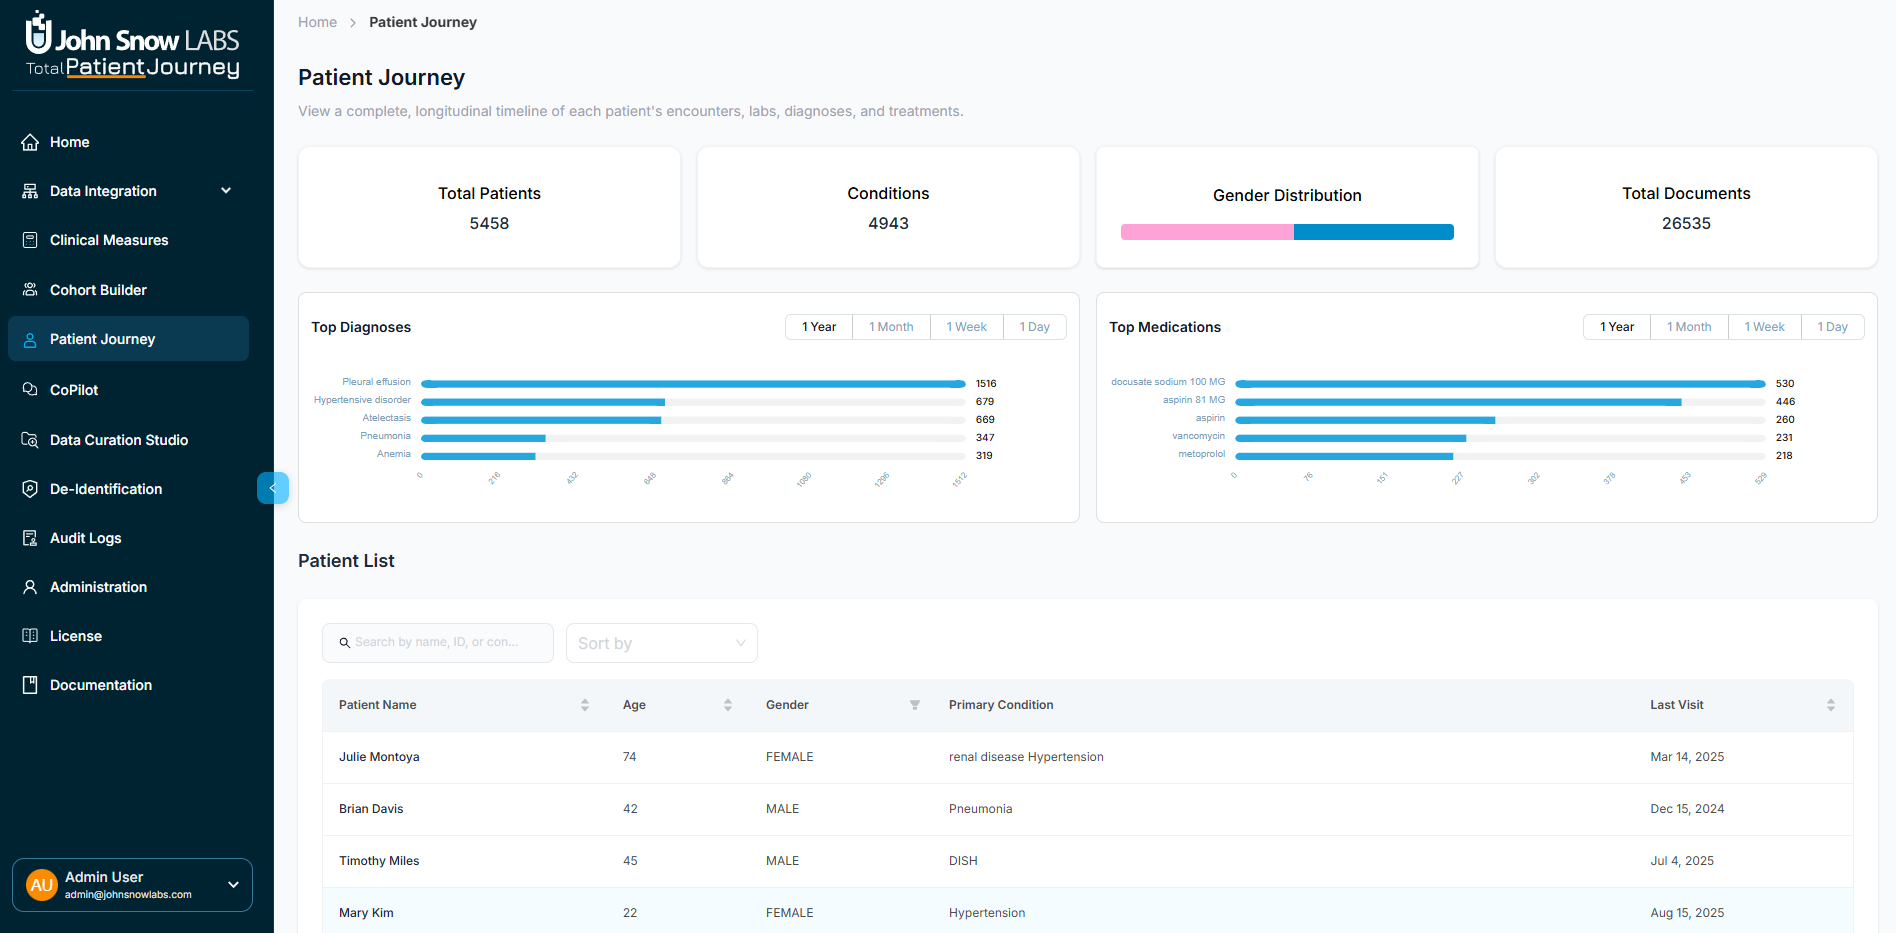
The Patient Journey dashboard provides population-level metrics, searchable patient lists, and detailed individual profiles with full clinical context
Identify Trending Diagnoses and Medications
Two analytic panels reveal the most frequently observed clinical patterns across your population, with adjustable time windows for different monitoring needs.
Trending Diagnoses displays the most prevalent conditions over selectable periods: the last 12 months, 30 days, 7 days, or 24 hours. This supports public health surveillance and helps identify emerging disease patterns.
Trending Medications shows the most commonly prescribed or administered drugs over the same intervals. Track prescribing trends, monitor formulary utilization, and detect unusual patterns that might warrant investigation.
Search and Navigate the Patient List
The Patient List serves as your entry point to individual longitudinal profiles. Find any patient quickly using the search and filtering capabilities:
- Search by patient ID, name, or condition
- Sort by age, last visit date, or demographic attributes
- Review key information at a glance: Name, Age, Gender, Primary Condition, and Last Visit Date
Click any row to open that patient's detailed profile.
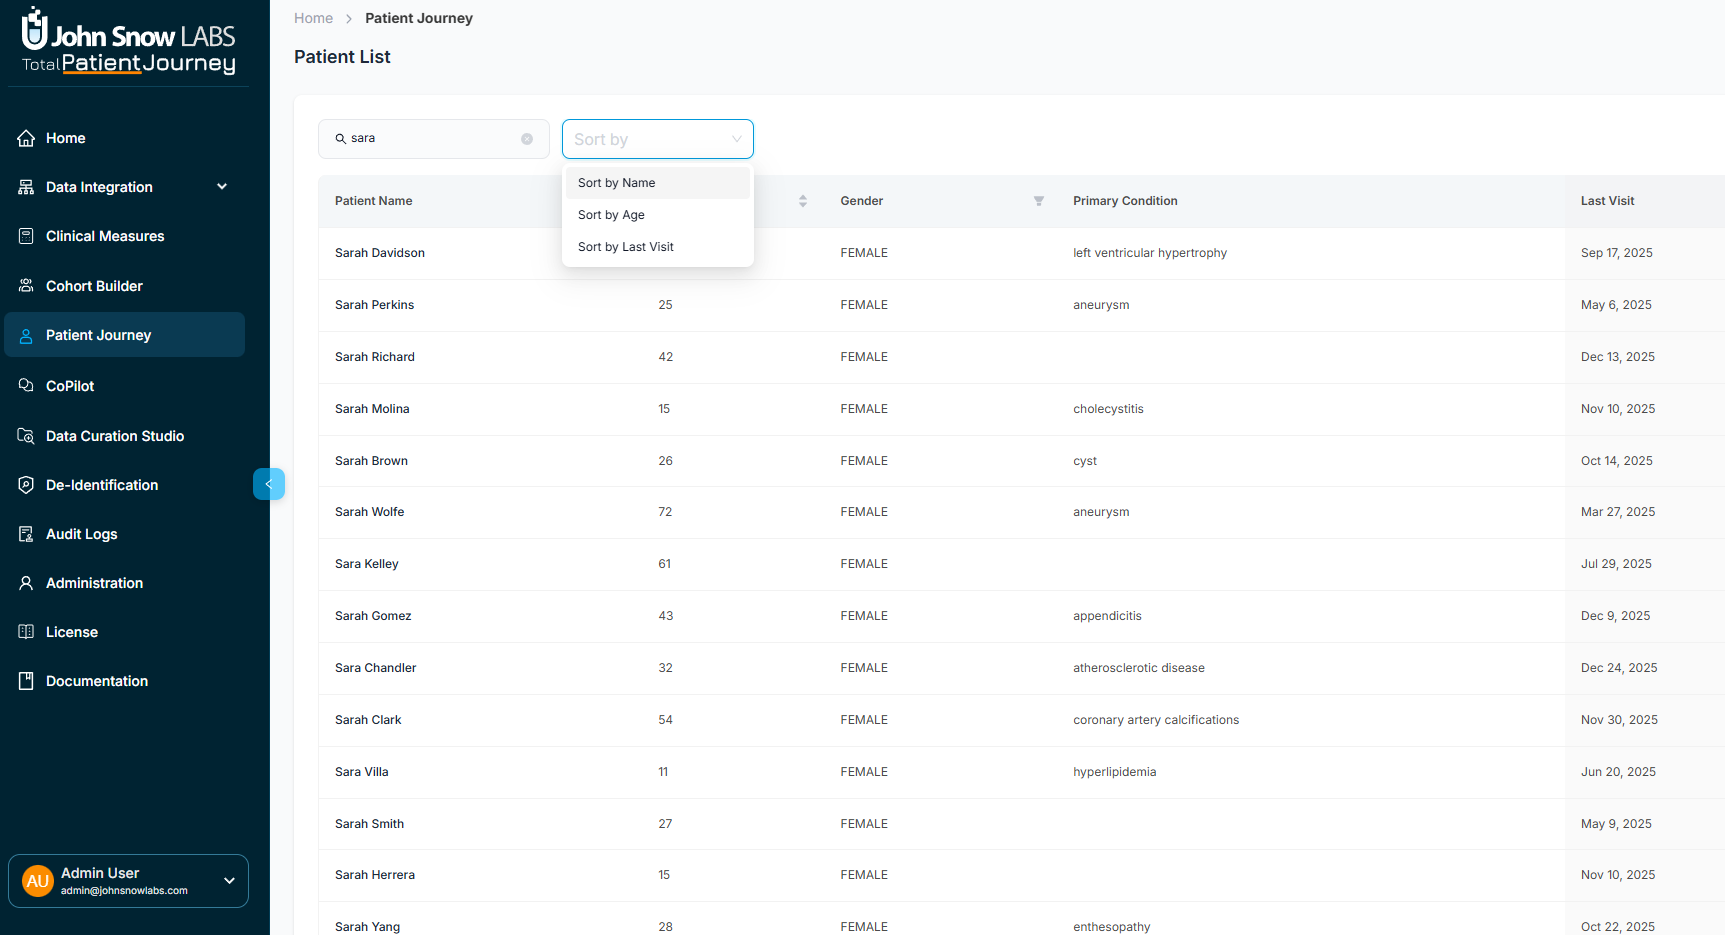
Search, sort, and filter the patient list to quickly find specific patients or patient groups
Review Patient Demographics and Clinical Summary
When you select a patient, a sidebar appears with essential demographic and clinical metadata, giving you immediate context before exploring the full journey.
Demographics include Patient ID, Age, Gender, Date of Birth, Race, and Ethnicity.
Clinical Summary shows the Primary Condition, Last Encounter Date, Total Visits, Total Documents, and a tag-based display of all diagnosed conditions.
Click Full Profile to open the complete longitudinal Patient Journey explorer.
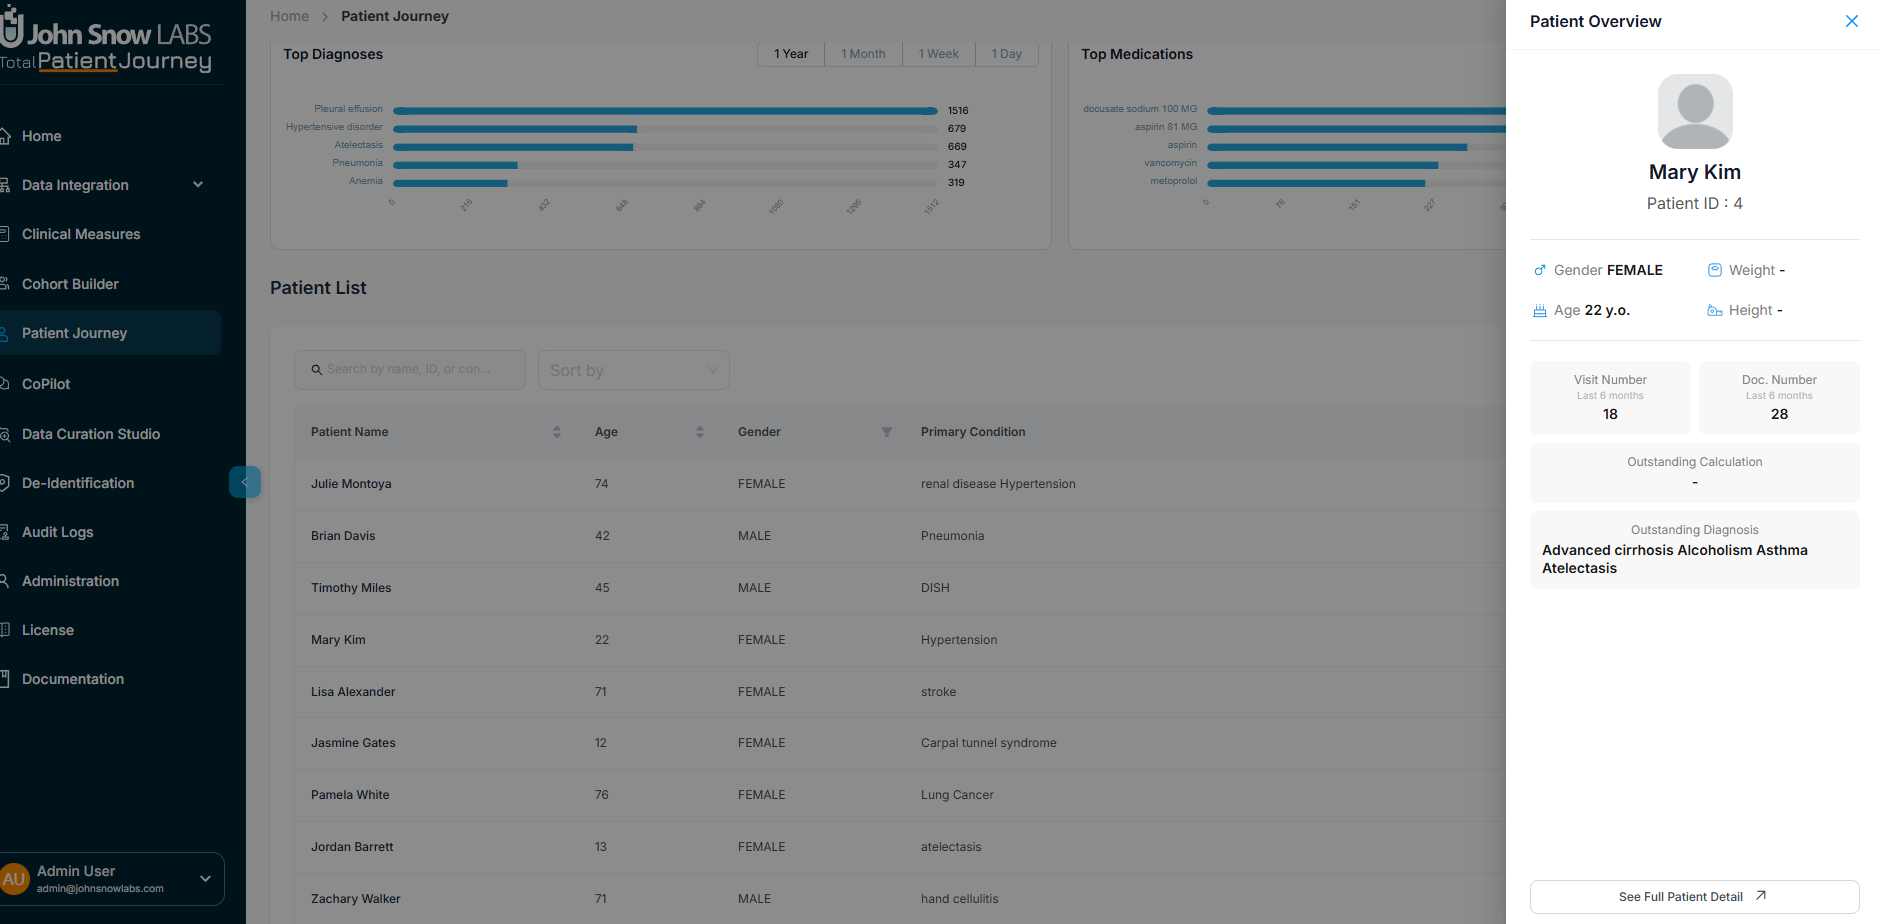
Patient sidebar displays demographics, clinical summary, and diagnosed conditions at a glance
Explore Eight Dimensions of Patient Data
Each patient profile is organized into eight focused sections. This structure lets you navigate directly to the information you need while maintaining access to the complete clinical picture.
Track All Encounters Across Care Settings
The Visits section lists every encounter chronologically, regardless of where care was delivered.
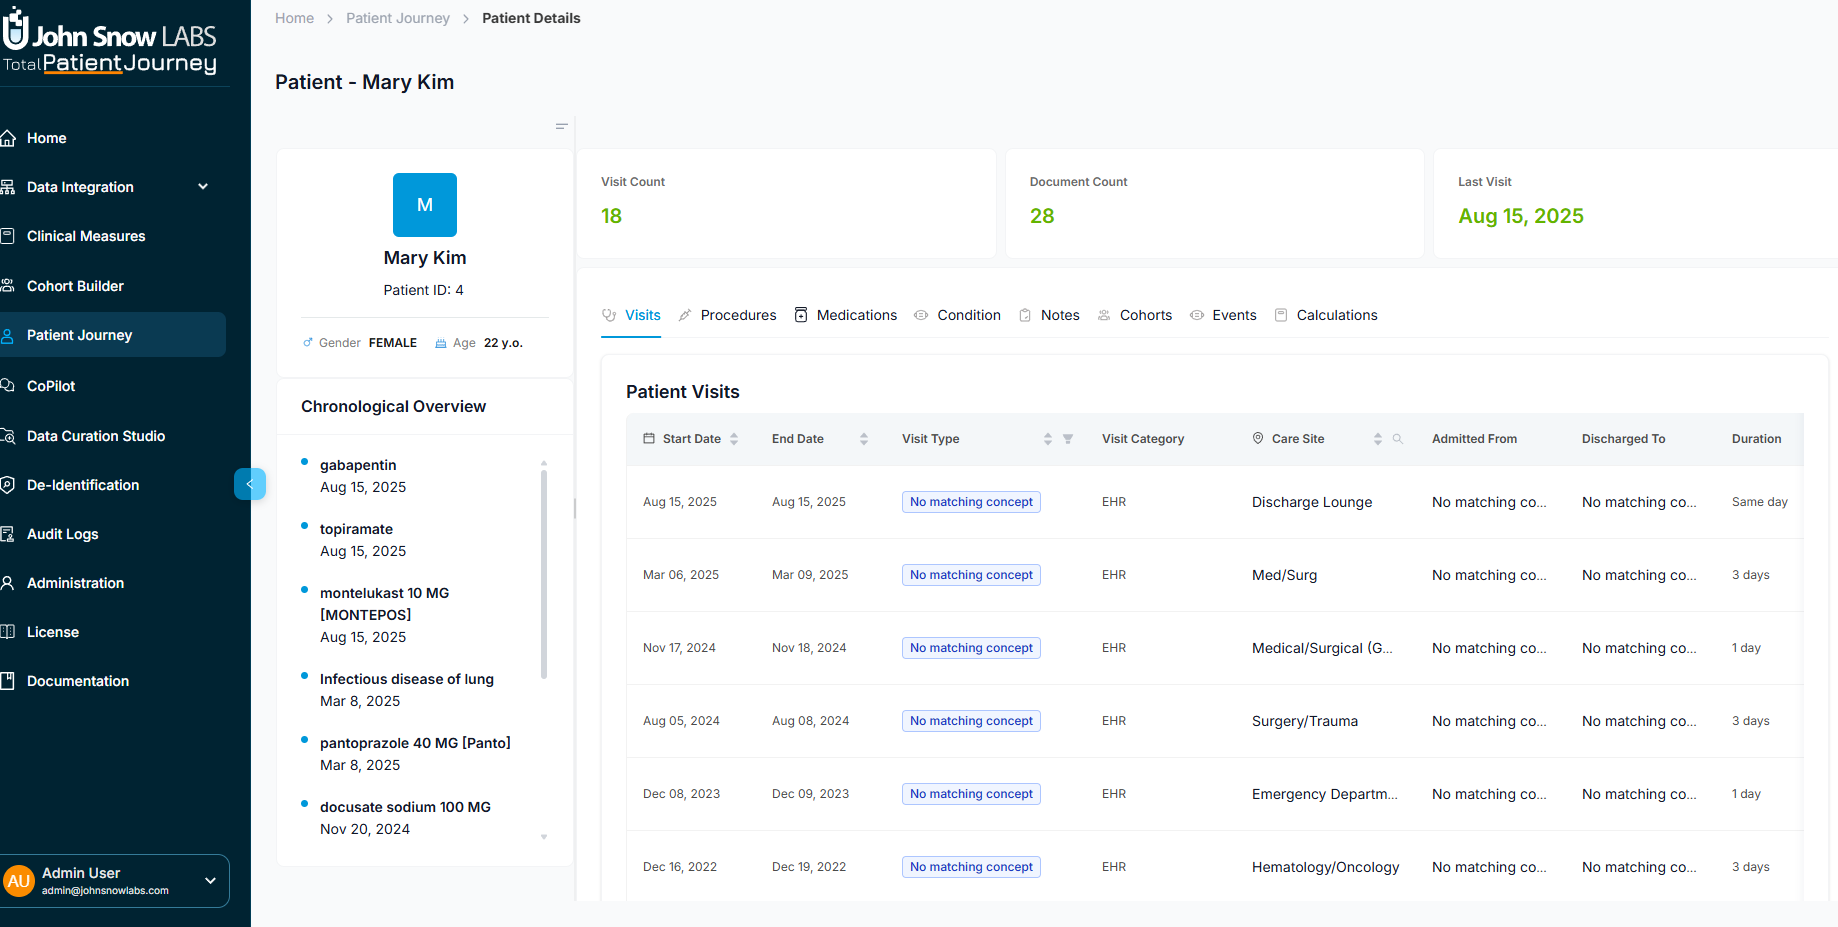
The full patient profile organizes clinical data into eight navigable sections for comprehensive longitudinal review
Each visit record includes:
- Visit Start and End dates
- Type — outpatient, inpatient, emergency department, and more
- Category — whether derived from EHR data or inferred through NLP
- Care Site — the facility where the encounter occurred
- Admission and Discharge details when applicable
Filter and sort by type, site, or date to find specific encounters. Select any visit to open a detailed drawer showing Visit ID, duration, source details, and admission metadata.
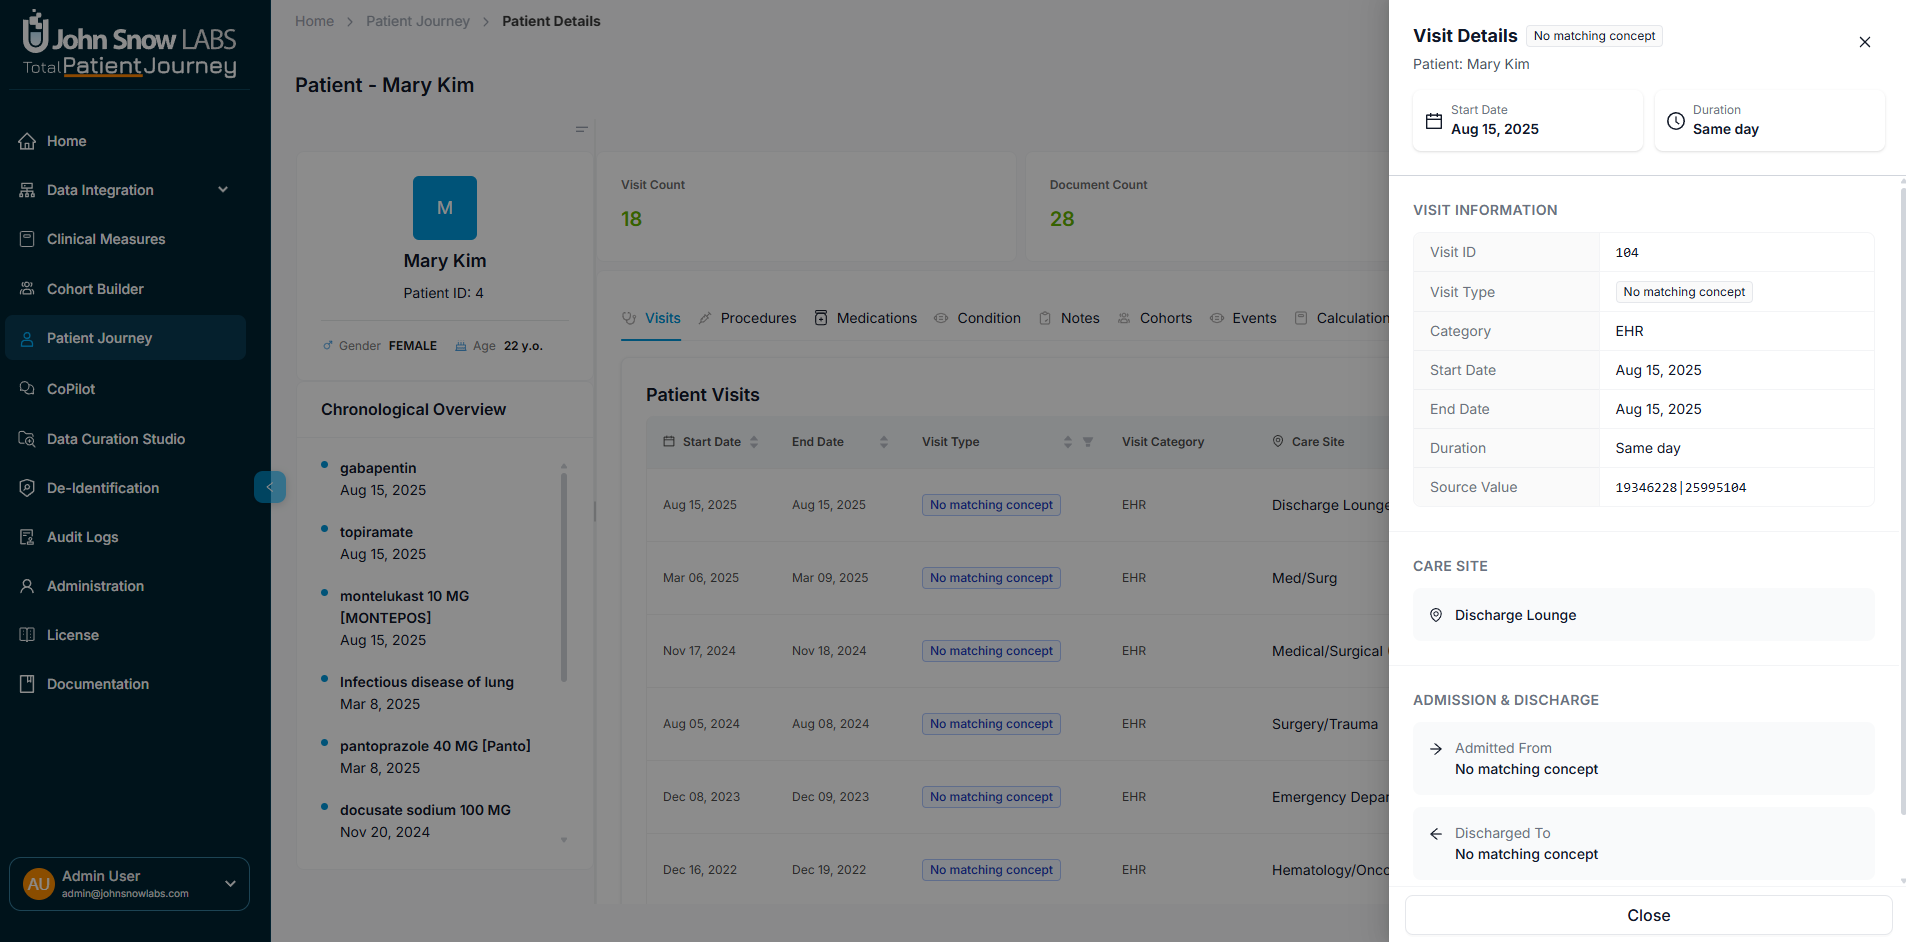
Click any visit to open a detailed drawer with complete encounter information and source details
Review Procedures with Full Provenance
The Procedures section displays all recorded procedures with complete documentation of their origin.
For each procedure, you can see:
- Procedure Name standardized to medical vocabularies
- Date the procedure was performed
- Data Source — whether captured from structured records or extracted via NLP
- Source Value — the original terminology as it appeared in the source system
- Clinical Chapter for categorical organization
- Provenance Viewer — click to see the original documentation snippet that supports this entry
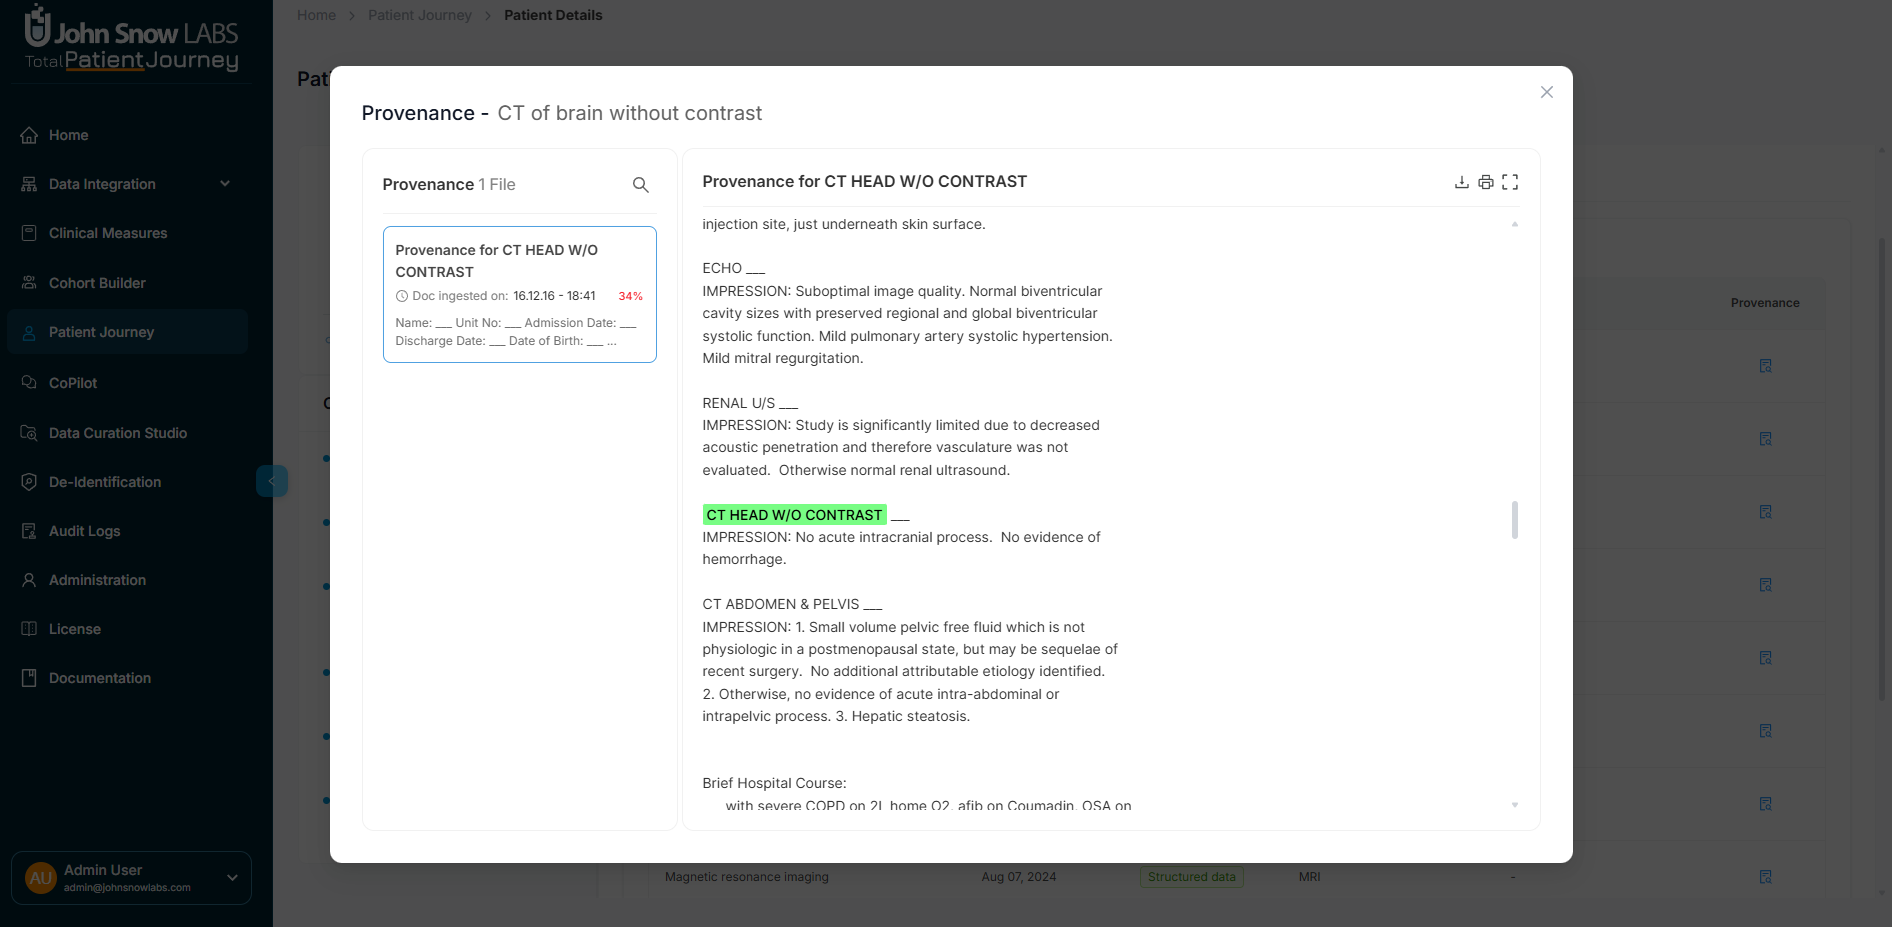
Click any procedure to view the provenance viewer with the original source documentation highlighted
Trace Medication History and Administration
The Medications section provides a complete view of prescription and administration history.
Each medication entry shows:
- Drug Name normalized to standard vocabularies
- Start and End Dates for the medication period
- Source Type — structured EHR data or NLP extraction
- Raw Source Value — the original text or code
- Provenance link when derived from clinical documentation
Use this section for medication reconciliation, treatment history analysis, and pharmacovigilance monitoring.
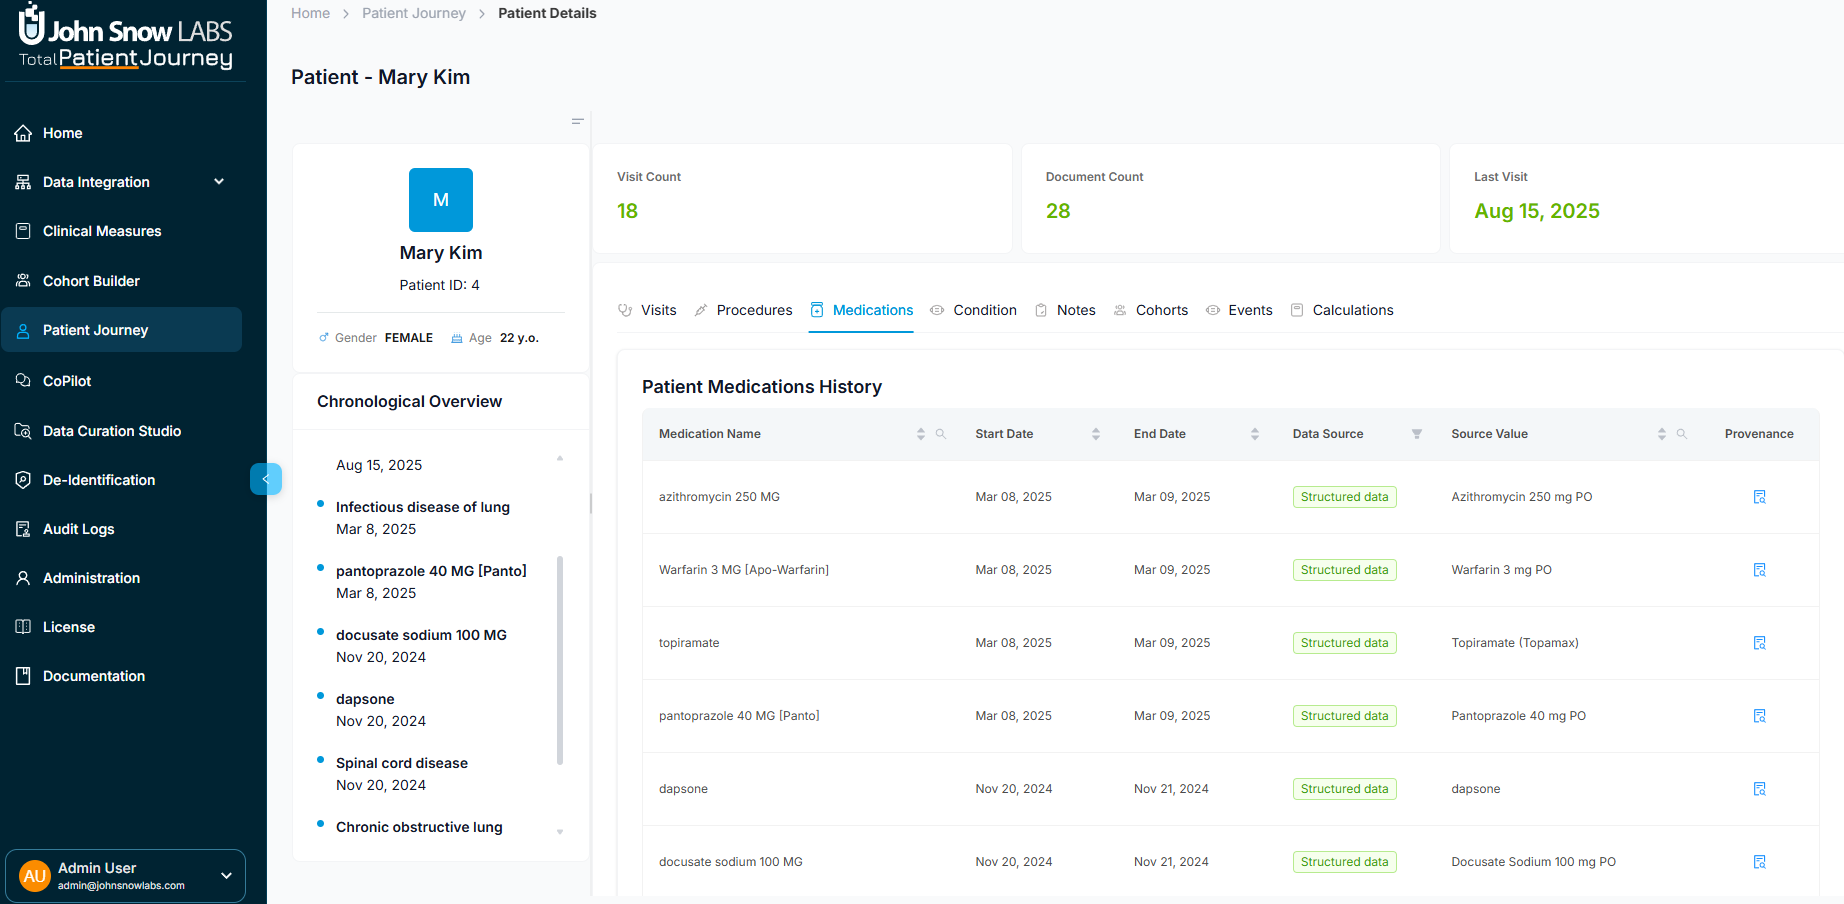
Track complete medication history with normalized drug names, dosing periods, and source provenance
Understand Conditions with Temporal Context
The Conditions section displays all clinical conditions attributed to the patient, whether captured from structured problem lists or extracted from clinical narratives.
Each condition includes:
- Condition Name mapped to standard terminology
- Timeframe — onset and resolution dates when available
- Source Type — EHR-based or NLP-derived
- Raw Source Value for reference
- Provenance linking back to the source documentation
Access Clinical Notes and Documentation
The Notes section provides direct access to the full text of clinical documentation, the richest source of clinical insight.
Browse notes by:
- Document Title
- Type — progress notes, discharge summaries, consultation reports, and more
- Date of documentation
- Source — structured import or NLP-processed
Click any note to open the Provenance Viewer, which displays the original text with extracted concepts highlighted and full metadata context. This ensures complete transparency into how structured outputs were derived from unstructured clinical narratives.
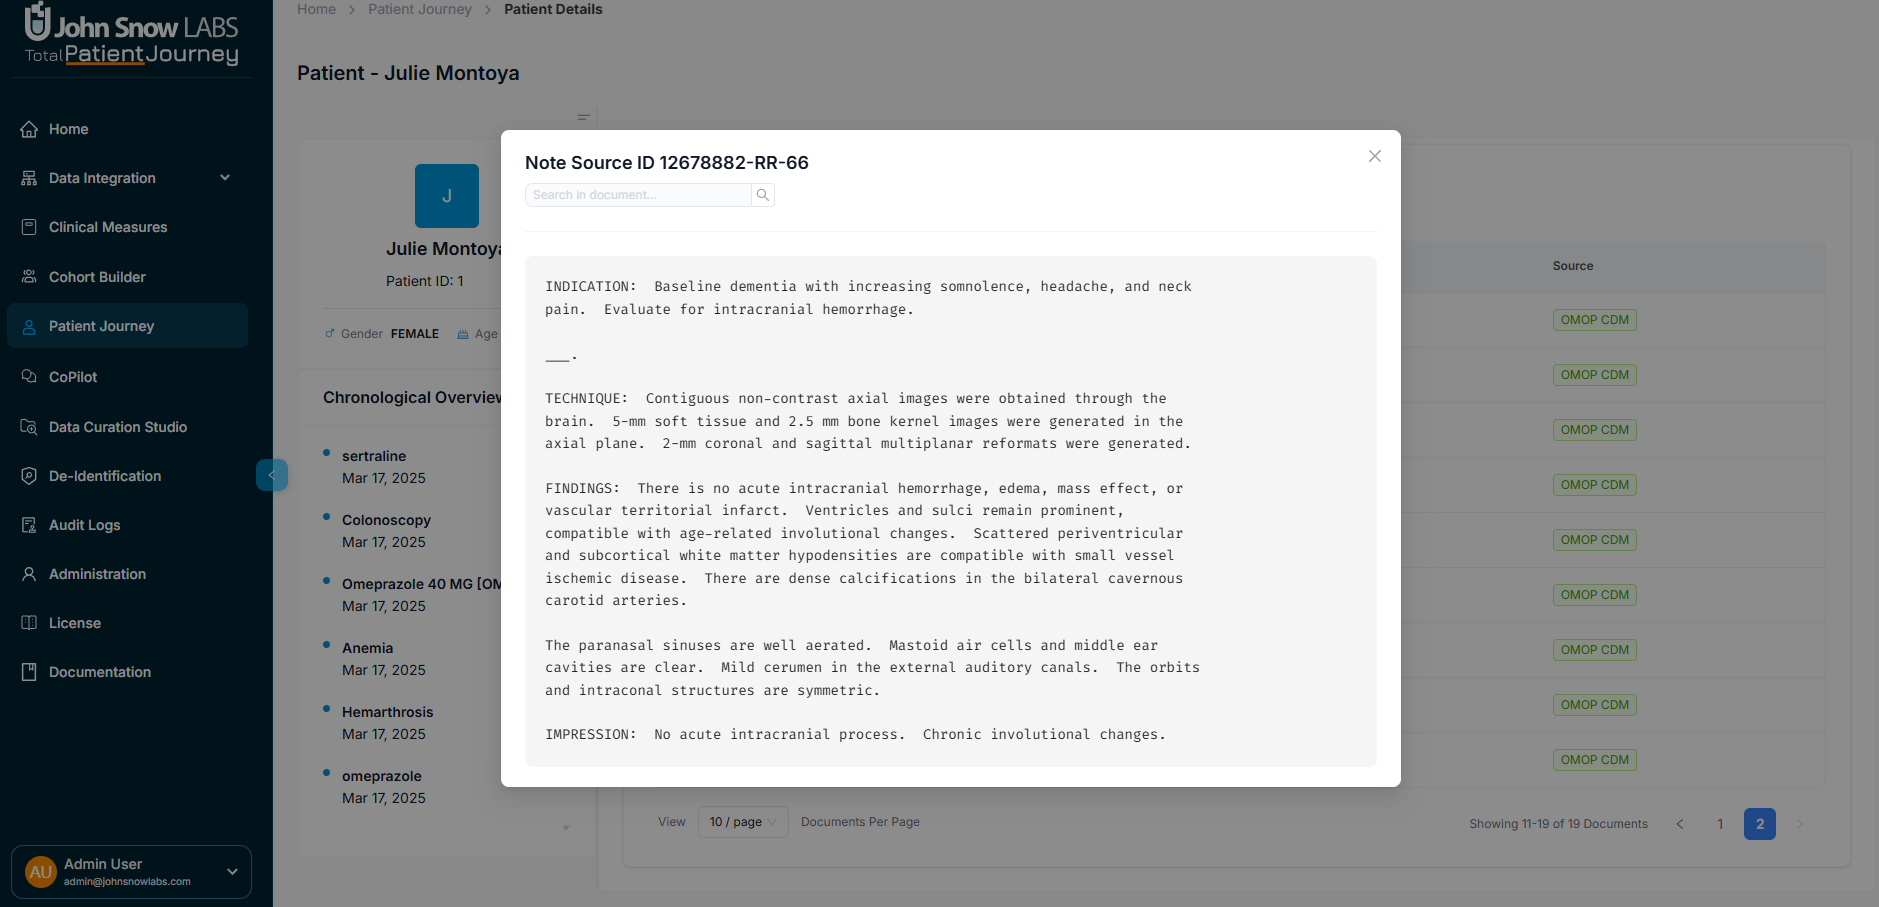
Browse clinical documentation by type and date, with direct access to full text
View Cohort Memberships
The Cohorts section shows all research or clinical cohorts the patient belongs to.
Each cohort entry displays:
- Cohort Name and Category
- Description of the cohort's purpose
- Patient Count and Document Count within the cohort
- Creation Date
If the patient isn't assigned to any cohorts, an empty state appears.
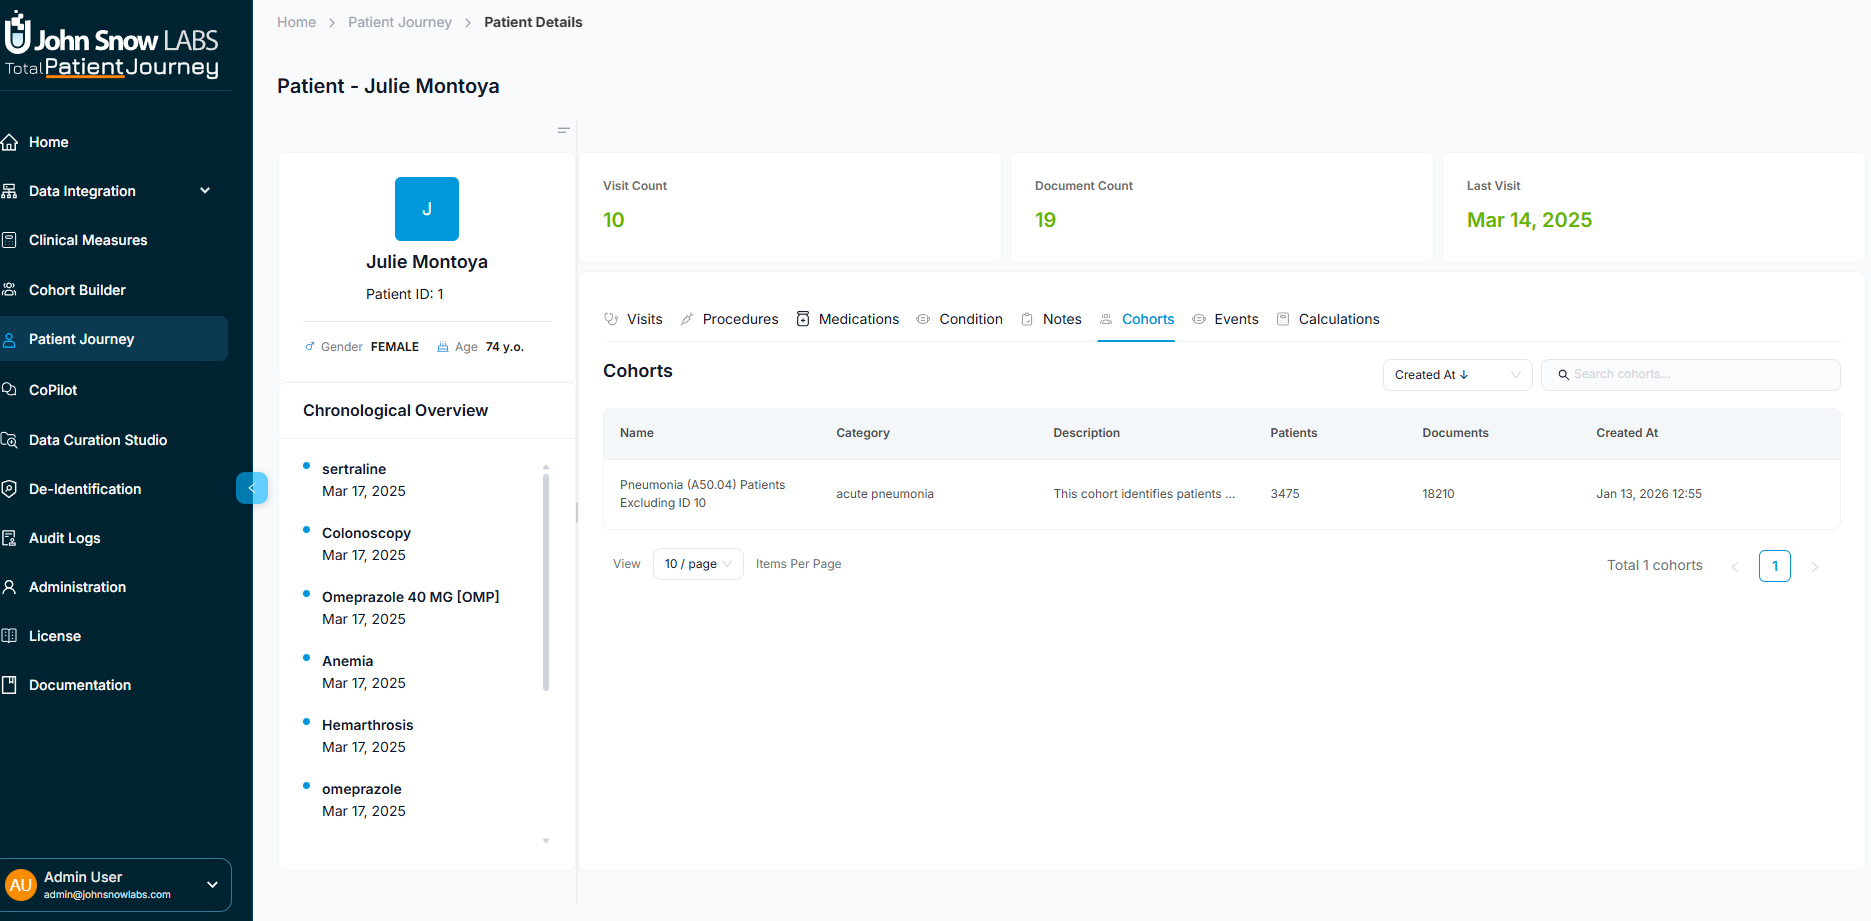
View all cohorts the patient belongs to with cohort details, descriptions, and membership counts
Explore All Clinical Events on a Unified Timeline
The Events section provides a temporal view that brings together every clinical event in one chronological stream.
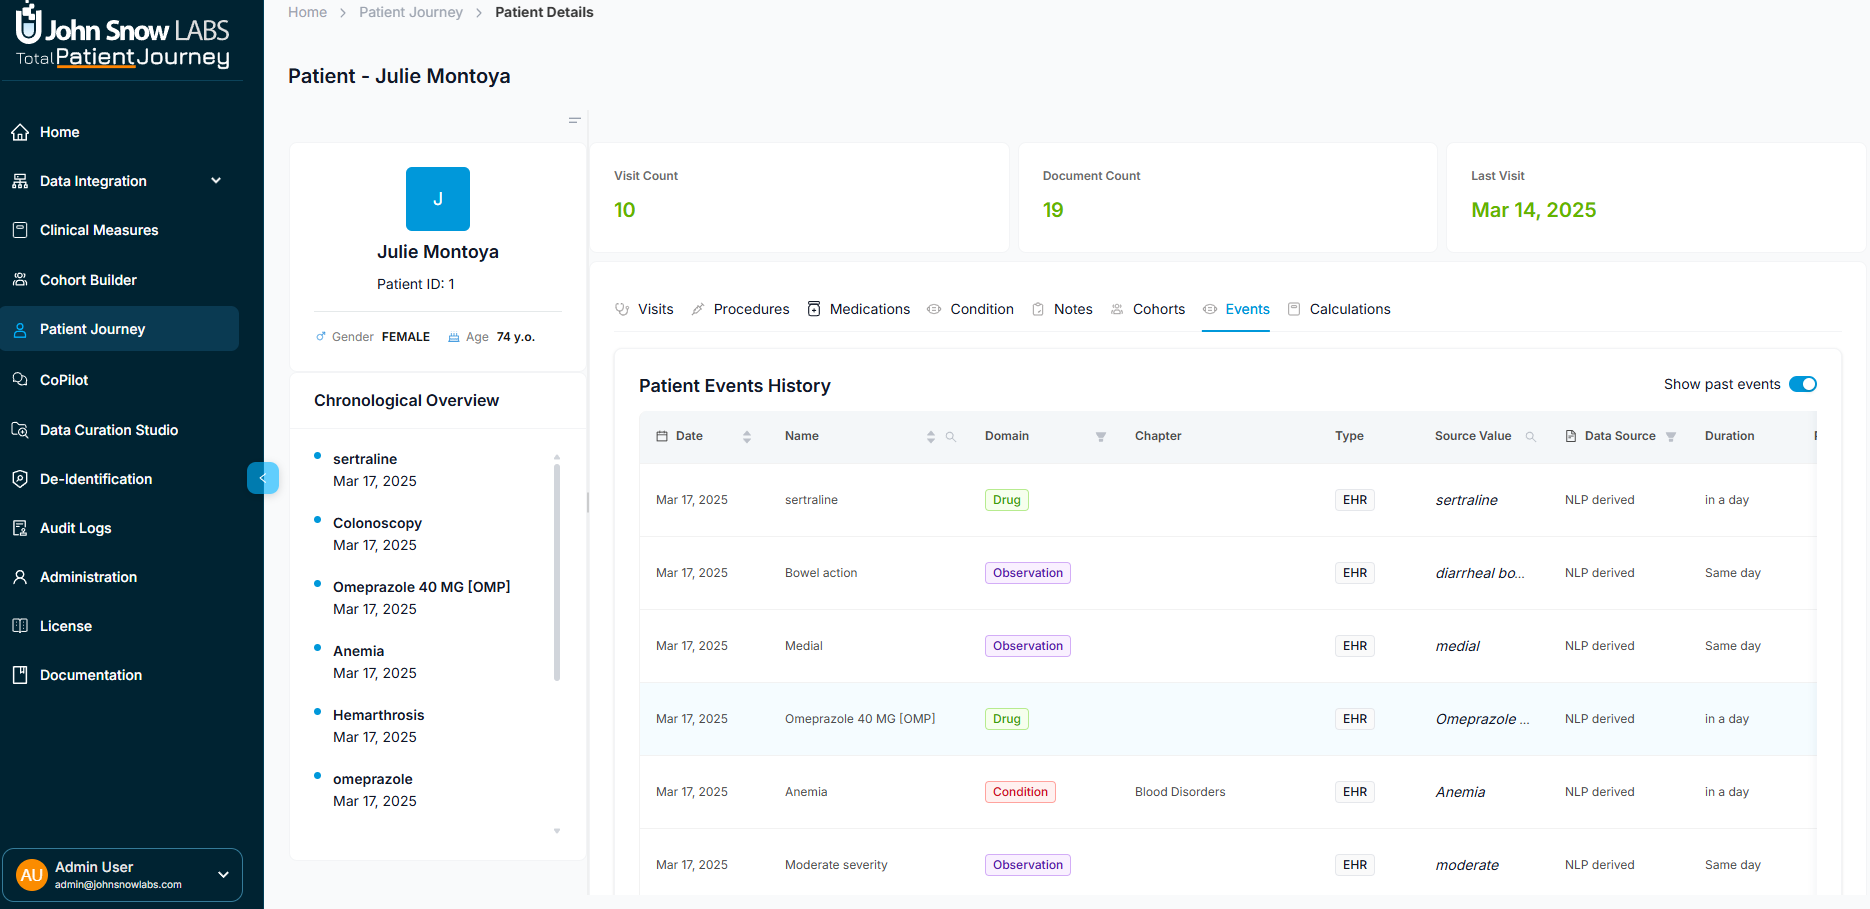
View all clinical events in a unified chronological timeline with filtering by event type or domain
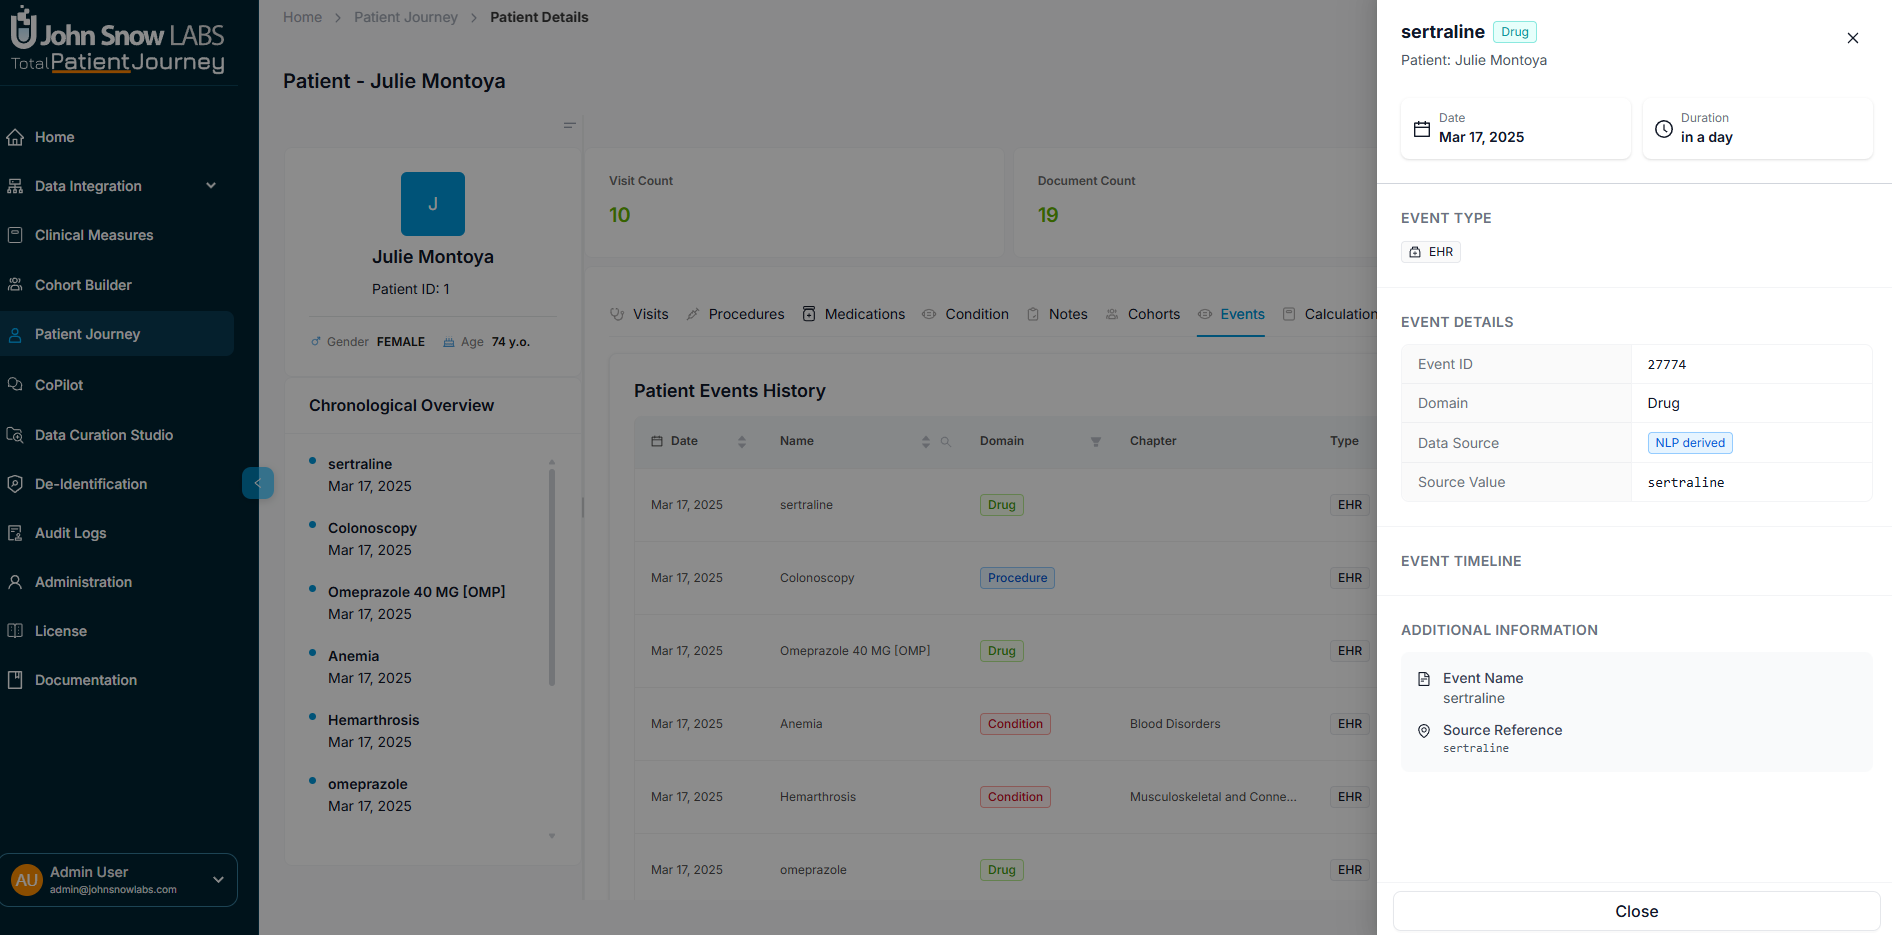
Each event displays:
- Event Date
- Name of the clinical occurrence
- Domain — Condition, Drug, Procedure, Observation, and more
- Chapter for categorical organization
- Type — EHR-recorded or NLP-derived
- Source Value for reference
Filter by event type or domain, and use the Past Events toggle to focus on historical patterns or recent activity.
Filter clinical events by type or domain and toggle past events to focus on specific timeframes
Review Calculated Scores and AI Predictions
The Calculations section displays clinically derived scores and model outputs that transform raw data into actionable insights. The platform includes over 50 pre-built clinical measures ready to use out of the box, and users can define custom measures for organization-specific calculations.
Examples of available measures include:
- A-a O2 Gradient for assessing oxygenation efficiency
- BMI (Body Mass Index) for weight status assessment
- BSA (Body Surface Area) for dosing calculations and physiologic assessments
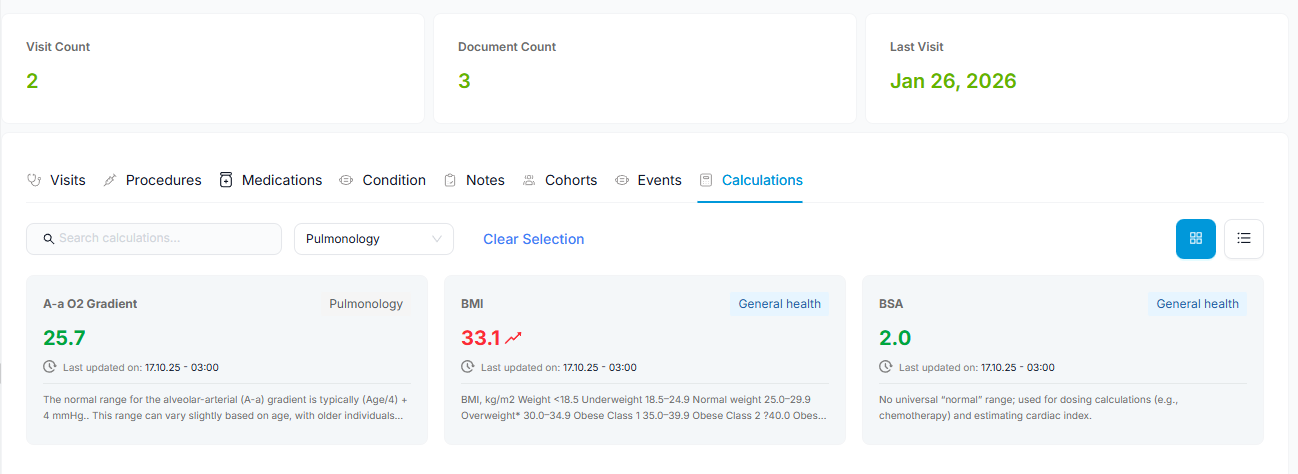
Review calculated clinical scores with filtering by category and flexible display options
Navigate using:
- Category-based filtering to focus on specific clinical domains
- Search functionality to find specific calculations
- Grid or List display modes for your preferred viewing style
- Include empty calculations toggle to see partially completed assessments
Why Patient Journey Matters
The Patient Journey module delivers what clinicians, researchers, and data stewards need most: a clinically interpretable, fully traceable, and analytics-ready view of every patient.
Build true longitudinal understanding by tracking patients across care settings, systems, and time periods in a single unified view.
Integrate all data sources including structured EHR records, unstructured clinical notes, and NLP-extracted insights into one coherent timeline.
Trust every data point through transparent provenance that links each clinical fact back to its source documentation.
Access embedded analytics with real-time calculations and risk scores computed directly within the patient context.
Connect to broader insights through seamless linkages to cohorts, conditions, and population-level analytics.
Whether you're conducting patient-specific clinical review, investigating disease progression for research, or validating data quality for operational purposes, Patient Journey ensures every insight is grounded in accurate, transparent, and longitudinally aligned data.